Hospitalisation of acute myocardial infarction during covid-19 pandemic
To reduce the spread of COVID-19, many countries have imposed social containment mandates (so called ‘lockdown’), which have resulted in a dramatic decline in local population movement, including emergency attendances at hospital. A number of studies have described a decline in patients with AMI presenting to hospital during this period, and some have suggested that people with symptoms of AMI may be delaying, or not, seeking help from the emergency medical services. To date, evidence concerning the presentation, care and outcomes from AMI during the COVID-19 pandemic is limited. Using livefeed national registry audit database MINAP (The Myocardial Ischaemia National Audit Project), this investigation details the first national insights around the patient and healthcare response to AMI during and in the recovery phase of the COVID-9 pandemic.
The study has been published as "Patient response, treatments and mortality for acute myocardial infarction during the COVID-19 pandemic" in the European Heart Journal – Quality of Care and Clinical Outcomes or could be accessed through the White Rose Research Online repository.
Summary results (updated 7th Sep 2020).
The analytical cohort was drawn from 117,327 patients hospitalised with AMI in England during the study period. Following exclusions, there were 57,458 patients admitted with AMI to 106 hospitals in England by 30th June 2020. Data included 20,704 STEMI and 36,754 NSTEMI.
Patients with AMI
From 23rd March, 2020, there was a 37.6% decrease to a nadir on 19th April in the number of hospitalisations with AMI, representing a decline in the median daily number of admission from 109 to 68 (IRR 0.64, 95% CI 0.61 to 0.67). From the nadir to 30th June 2020, the median number of admission increased to 94 (1.33, 95% CI 1.30 to 1.35), and qualitatively plateaued after an initial recovery (Figure 1).
Figure 1: Times series of daily hospitalisations of acute myocardial infarction between 3rd November 2019 and 30th June 2020, by STEMI and NSTEMI
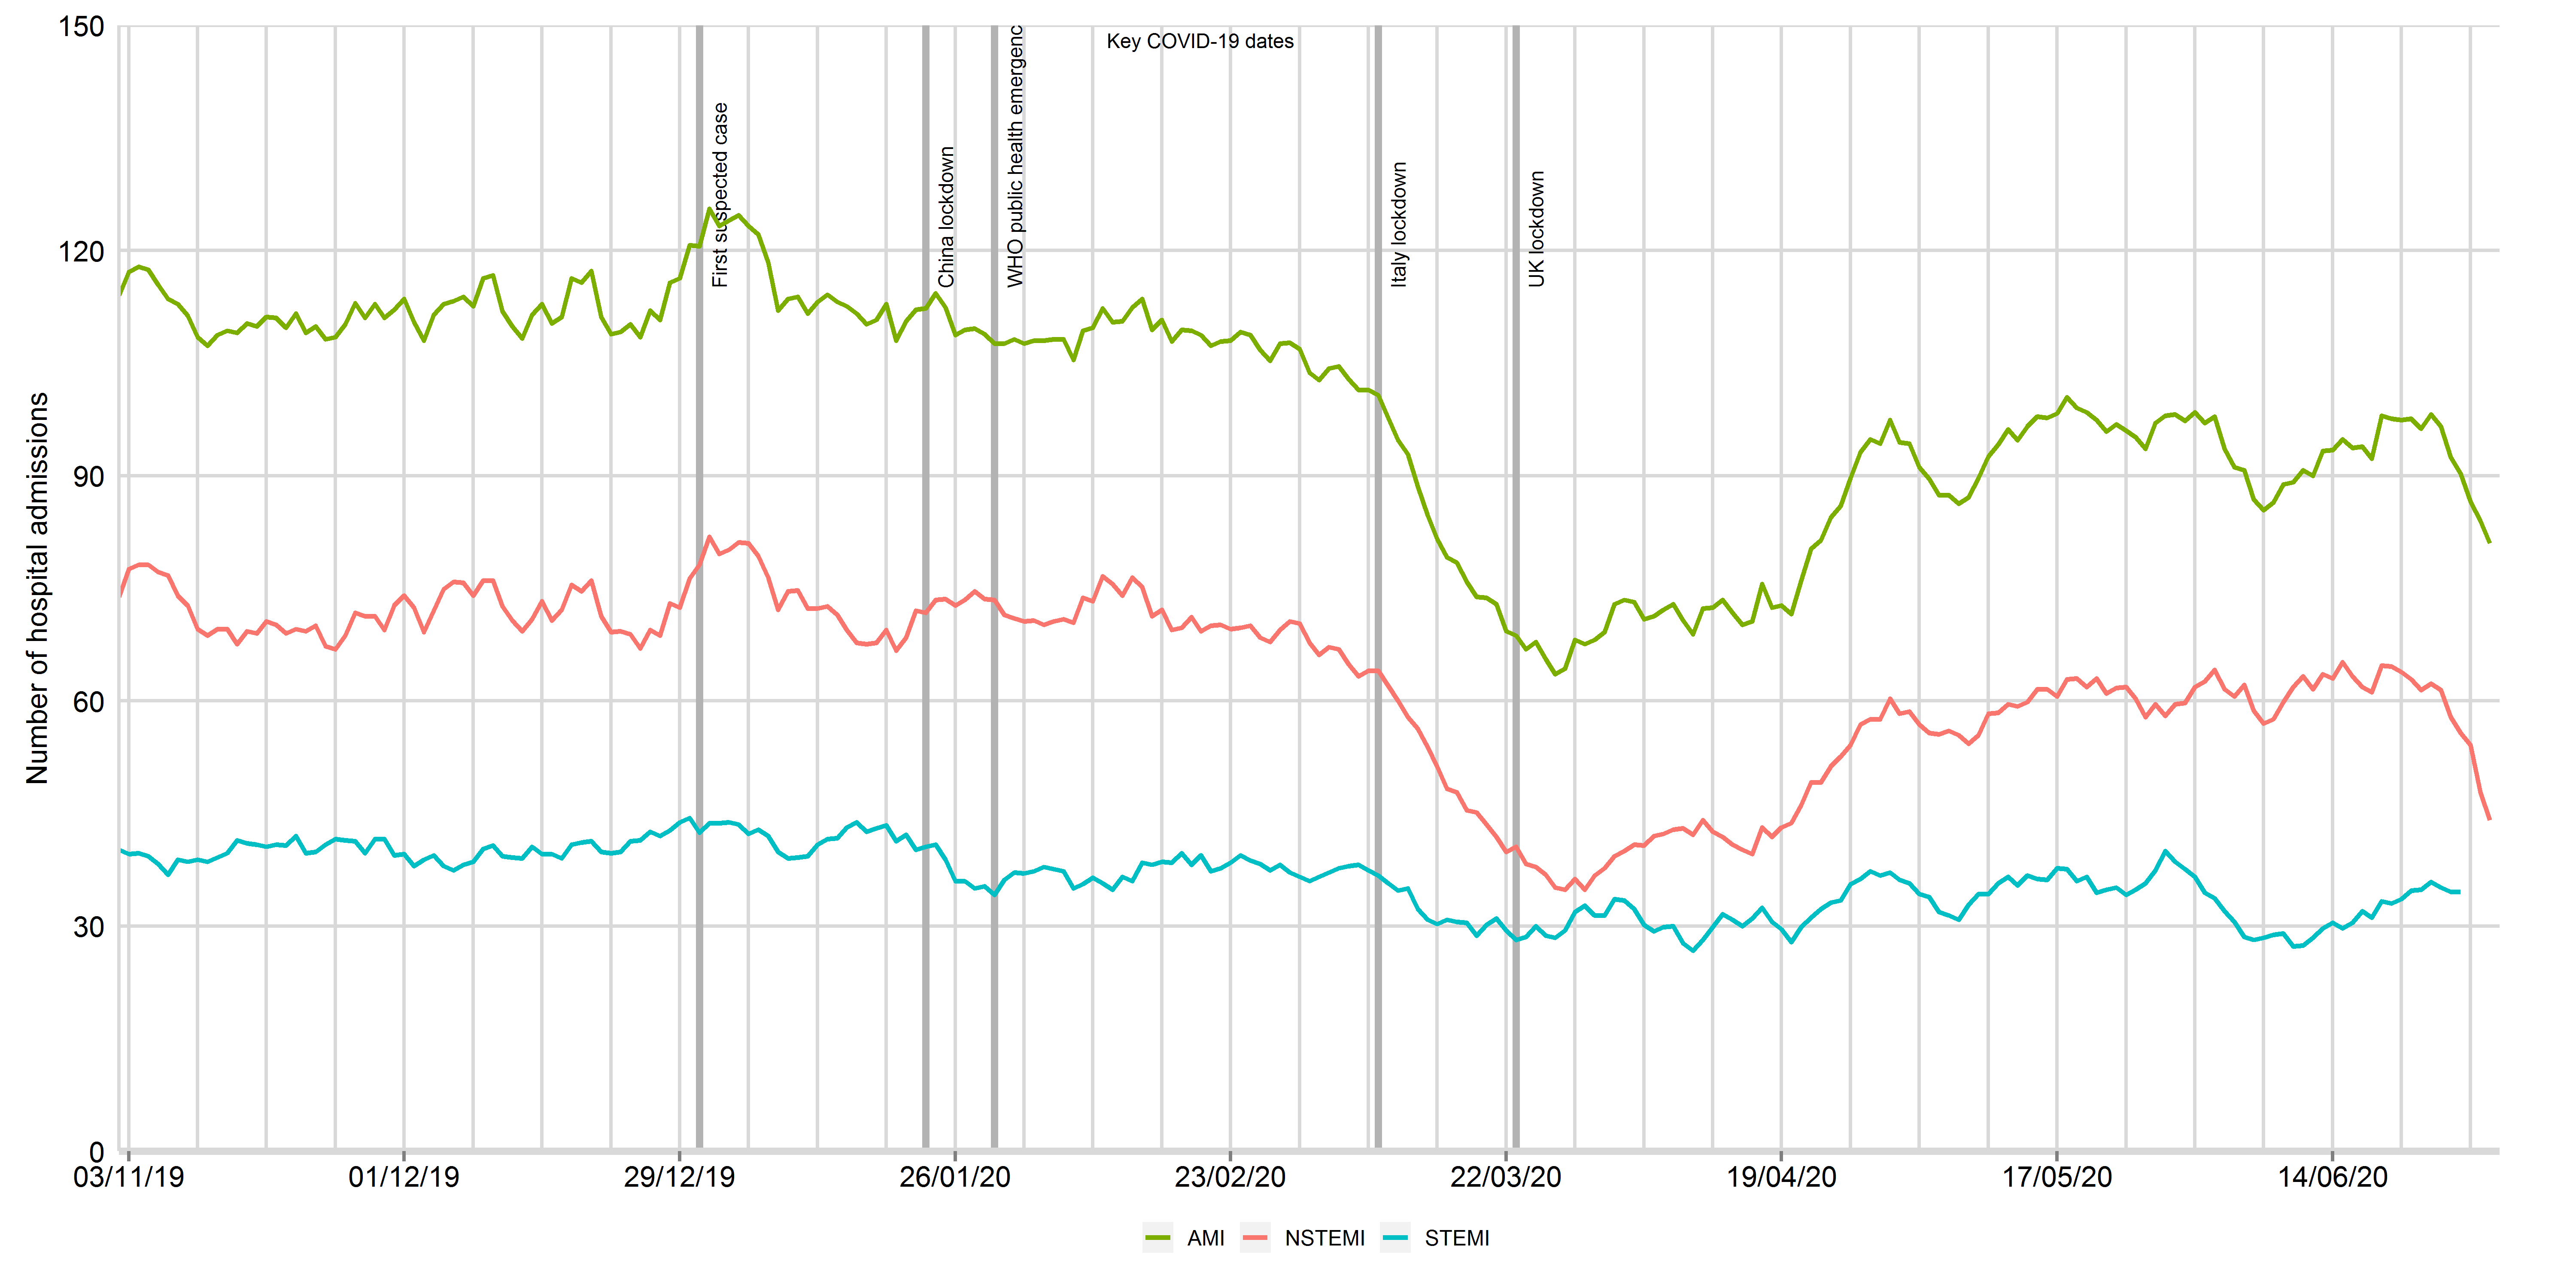
Data from 106 National Health Service hospitals in England with complete uploaded data up until 30th June 2020. Lines represent a 7-day simple moving average (indicating the mean number of daily admissions for that day and the preceding 6 days), adjusted for seasonality. The dates of the COVID lockdown including first suspect case (31st December 2019), China lockdown (23rd January 2020), World Health Organisation declaration of a public health emergency (30th January 2020) and UK lockdown (23rd March 2020) are shown with a bold vertical line. AMI: acute myocardial infarction; STEMI: ST-elevation myocardial infarction; NSTEMI: non-ST elevation myocardial infarction
Figure 1: Times series of daily hospitalisations of acute myocardial infarction between 3rd November 2019 and 15th August 2020, by STEMI and NSTEMI
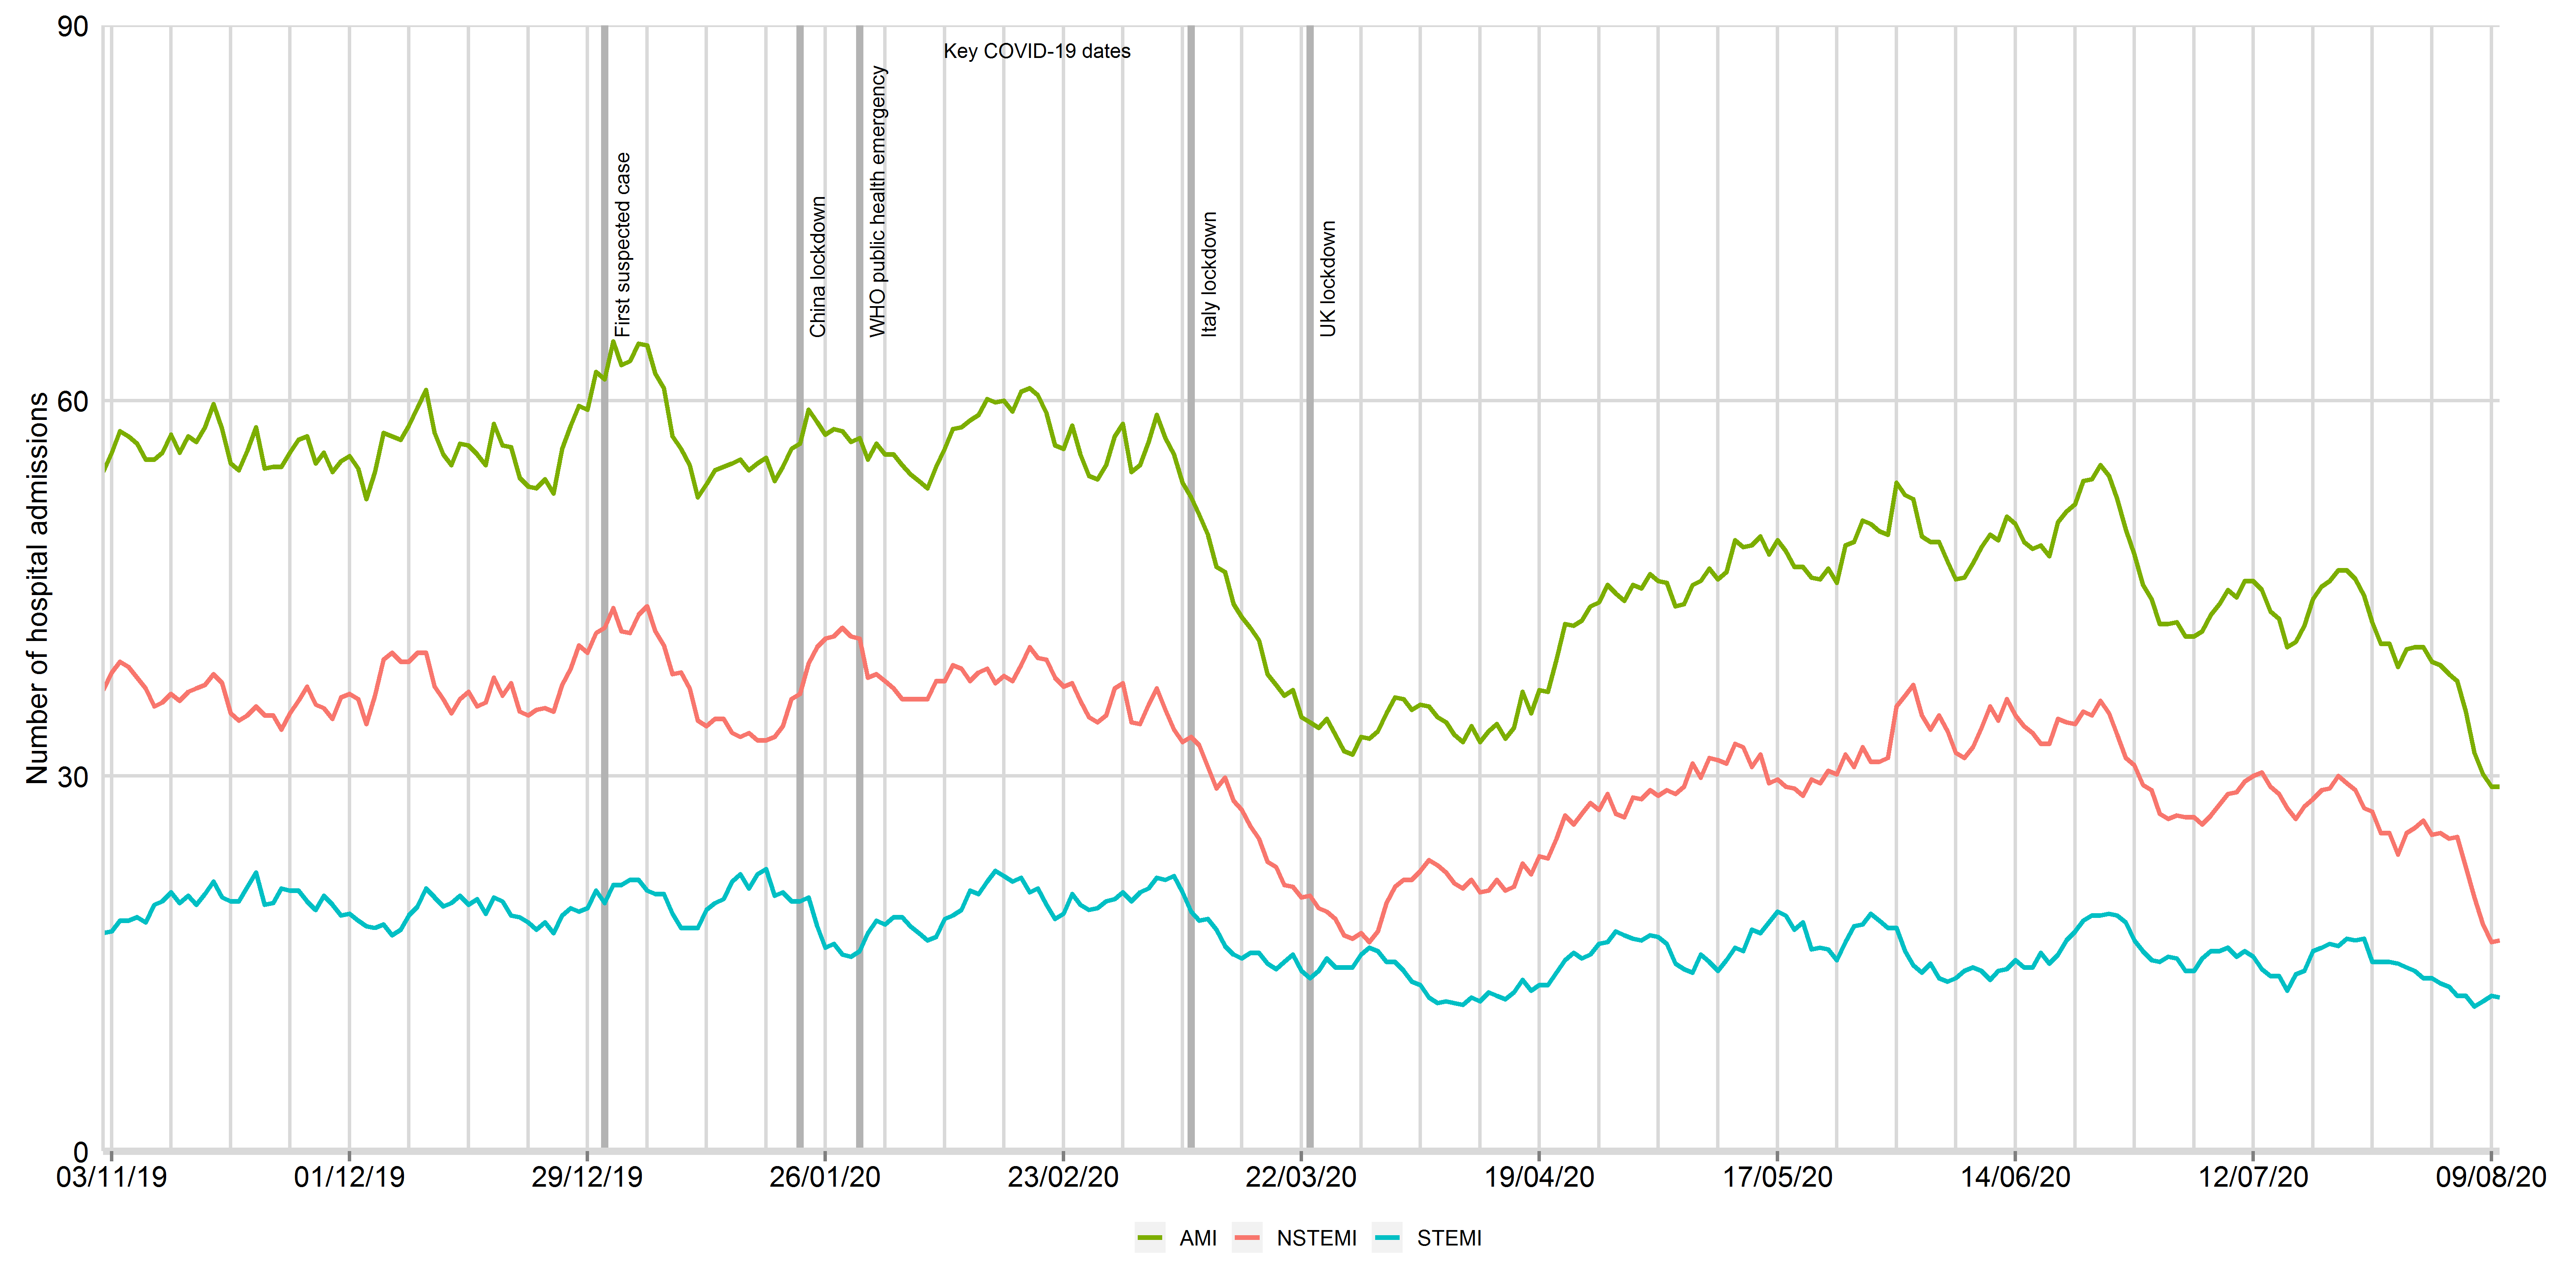
Data from 48 National Health Service hospitals in England with complete uploaded data up until 15th August 2020. Lines represent a 7-day simple moving average (indicating the mean number of daily admissions for that day and the preceding 6 days), adjusted for seasonality. The dates of the COVID lockdown including first suspect case (31st December 2019), China lockdown (23rd January 2020), World Health Organisation declaration of a public health emergency (30th January 2020) and UK lockdown (23rd March 2020) are shown with a bold vertical line. AMI: acute myocardial infarction; STEMI: ST-elevation myocardial infarction; NSTEMI: non-ST elevation myocardial infarction
Figure 1: Times series of daily hospitalisations of acute myocardial infarction between 3rd November 2019 and 30th September 2020, by STEMI and NSTEMI (updated 11th November 2020)
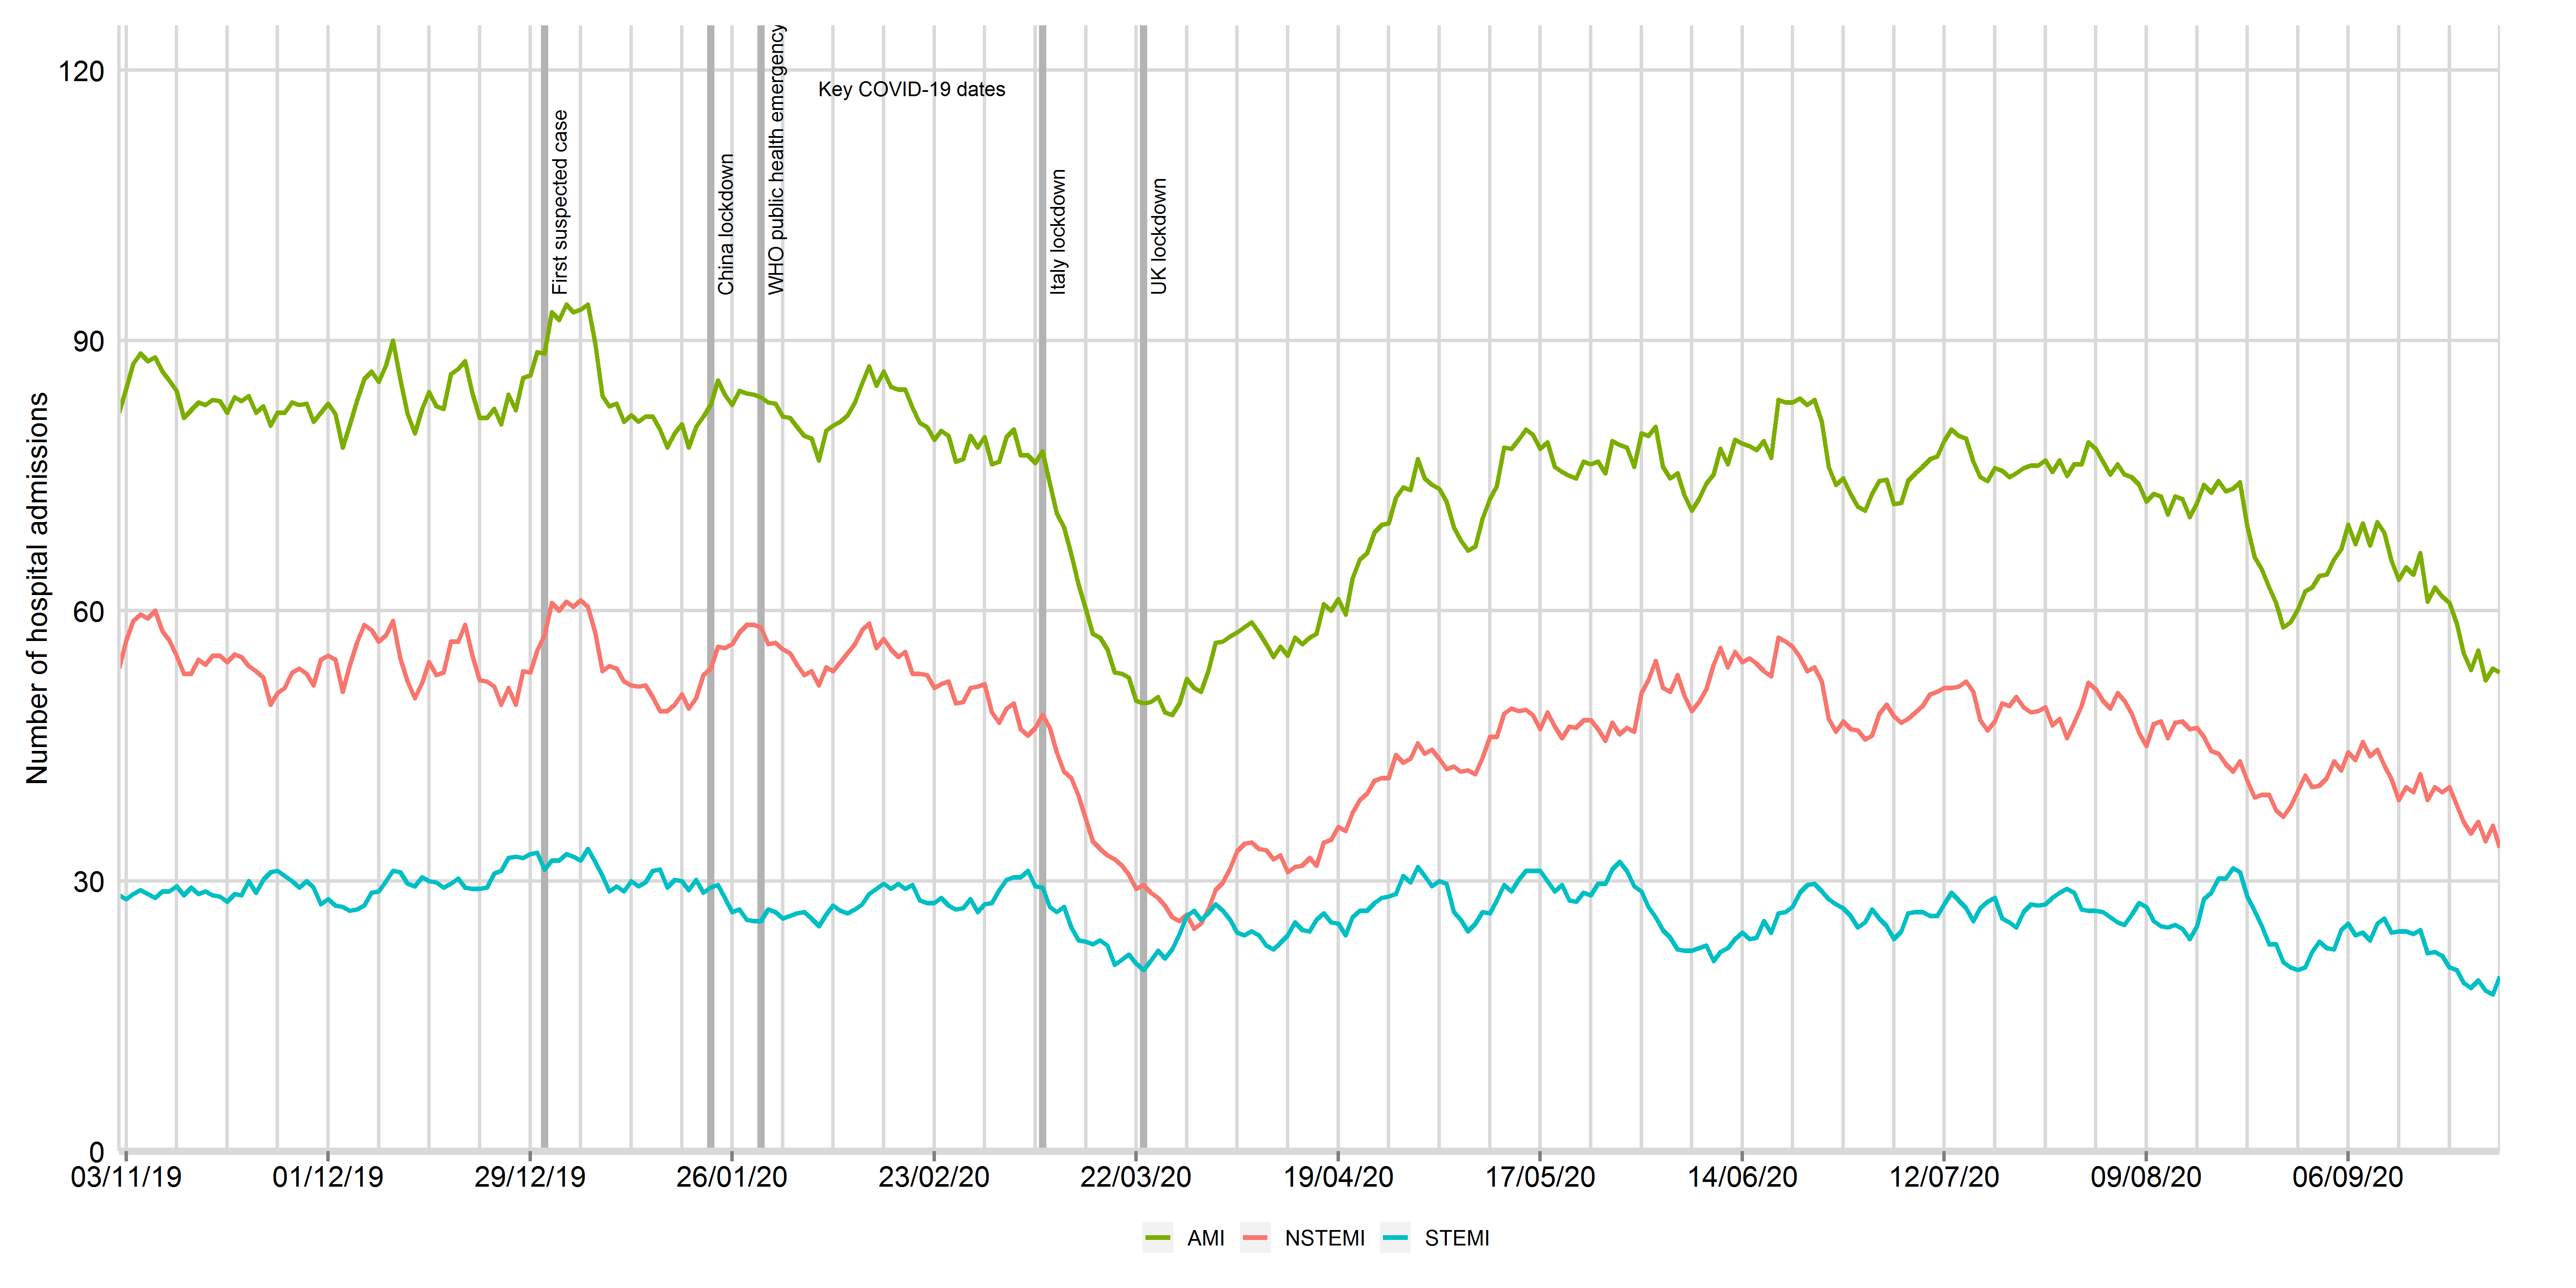
Data from 81 National Health Service hospitals in England with complete uploaded data up until 30th September 2020. Lines represent a 7-day simple moving average (indicating the mean number of daily admissions for that day and the preceding 6 days), adjusted for seasonality. The dates of the COVID lockdown including first suspect case (31st December 2019), China lockdown (23rd January 2020), World Health Organisation declaration of a public health emergency (30th January 2020) and UK lockdown (23rd March 2020) are shown with a bold vertical line. AMI: acute myocardial infarction; STEMI: ST-elevation myocardial infarction; NSTEMI: non-ST elevation myocardial infarction
Figure 1: Times series of daily hospitalisations of acute myocardial infarction between 3rd November 2019 and 8th December 2020, by STEMI and NSTEMI (updated 11th Feb 2021)
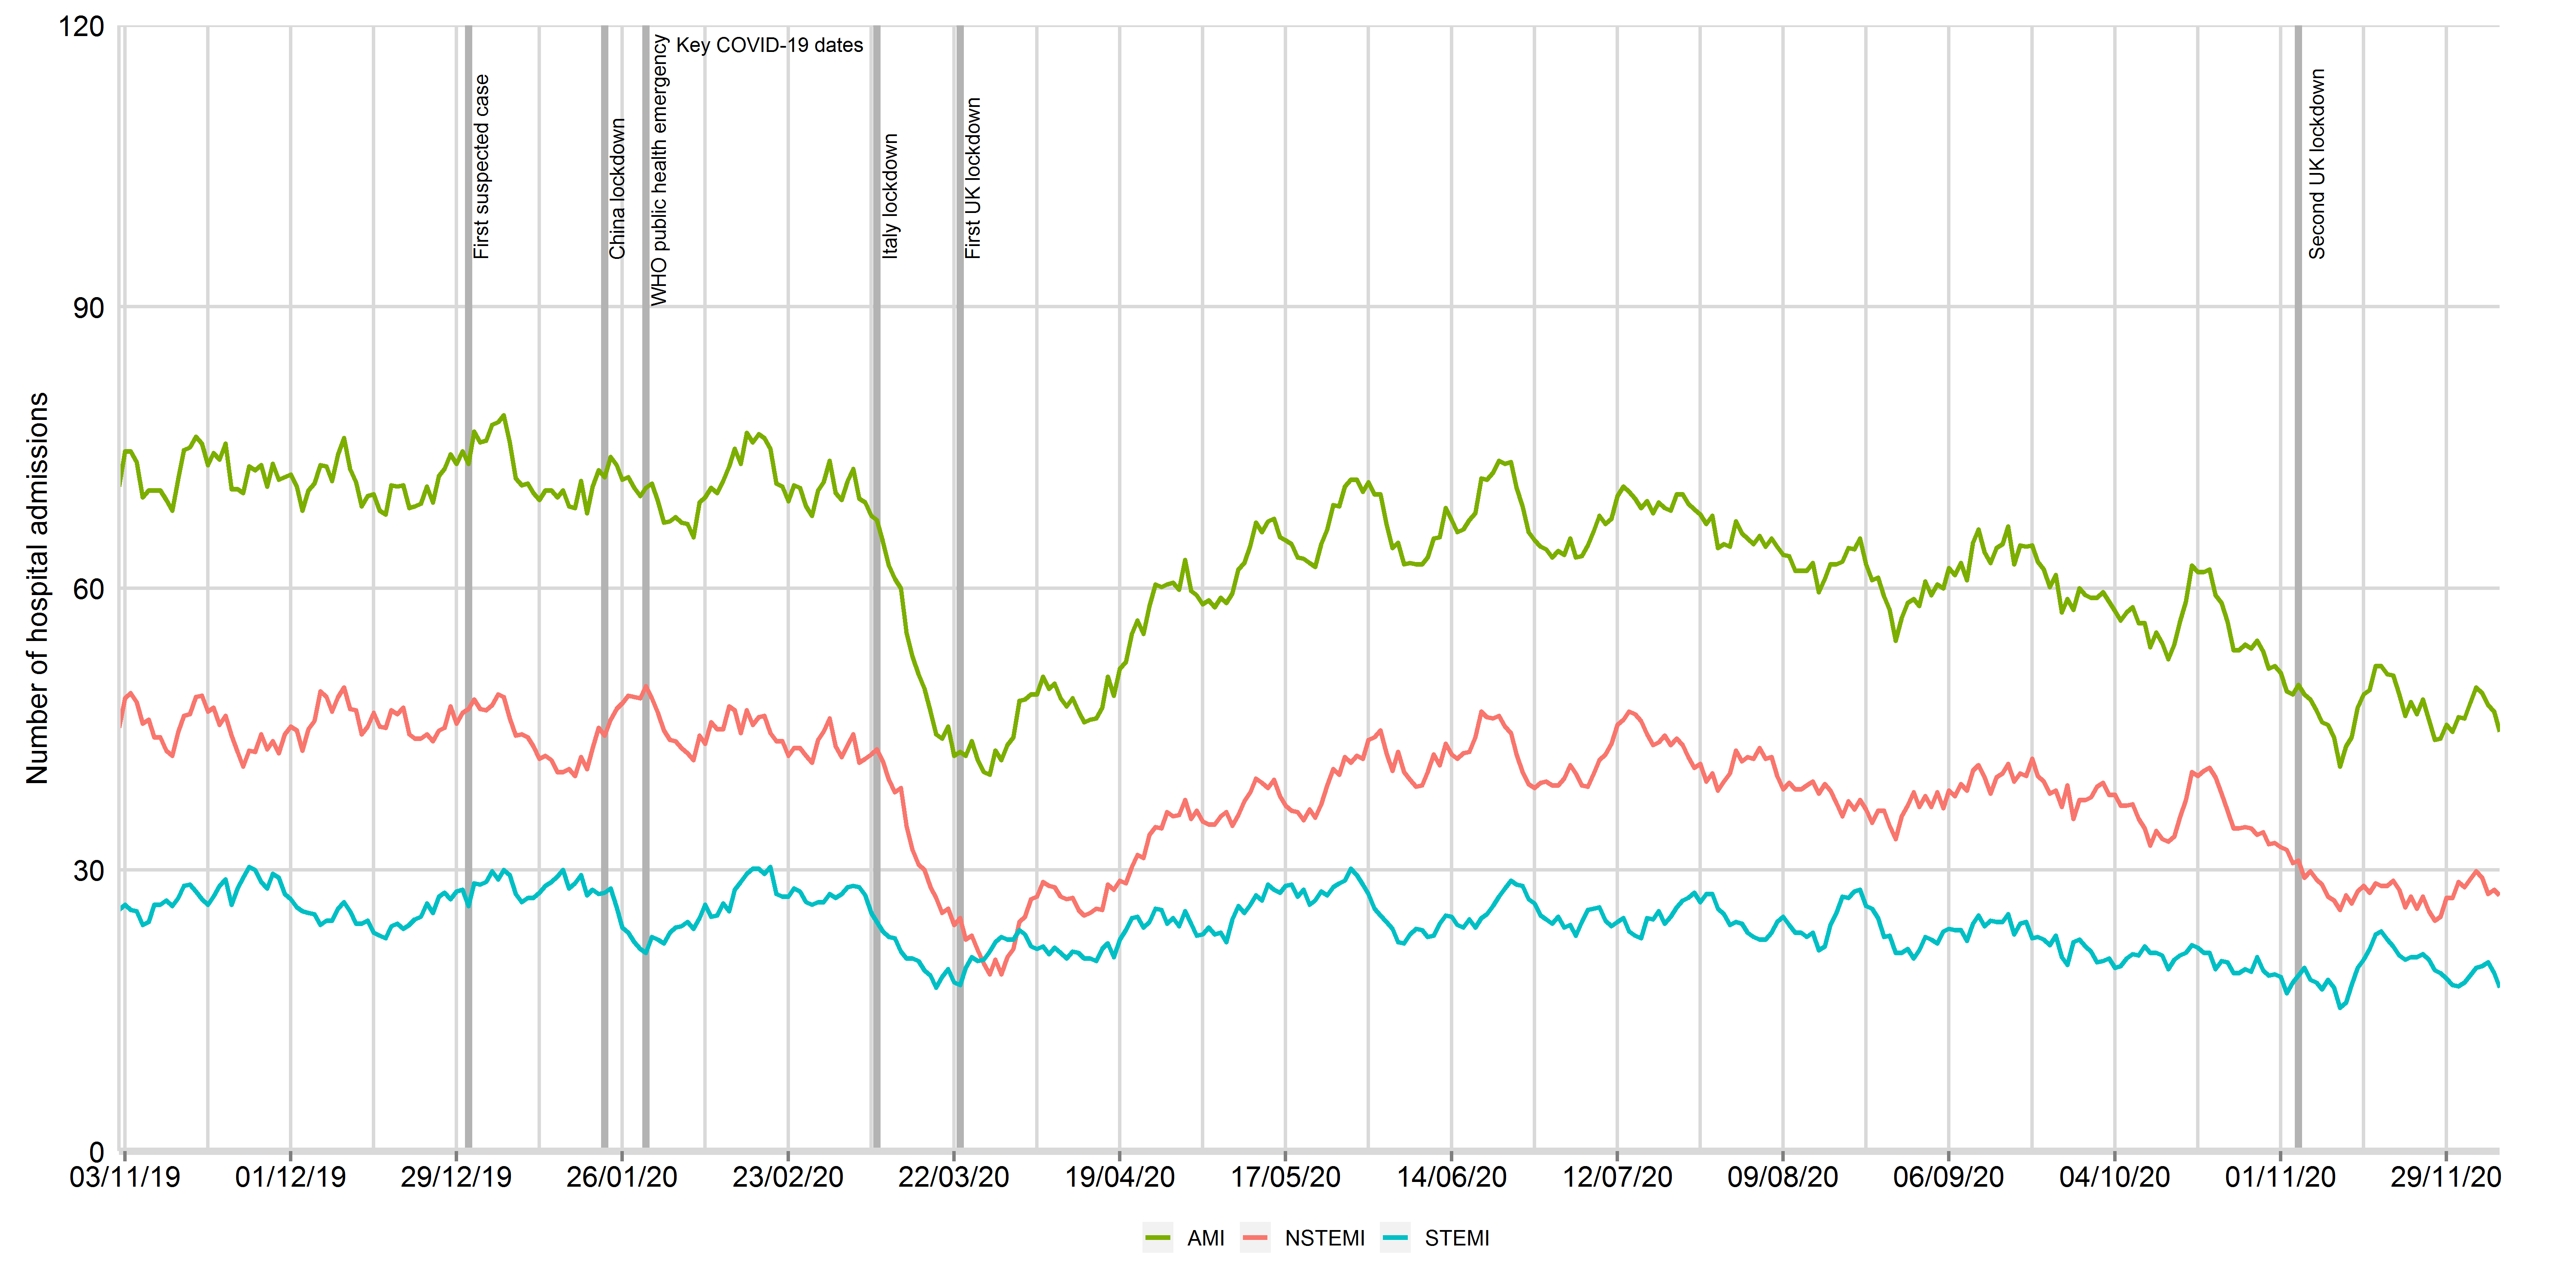
Data from 66 National Health Service hospitals in England with complete uploaded data up until 8th December 2020. Lines represent a 7-day simple moving average (indicating the mean number of daily admissions for that day and the preceding 6 days), adjusted for seasonality. The dates of the COVID lockdown including first suspect case (31st December 2019), China lockdown (23rd January 2020), World Health Organisation declaration of a public health emergency (30th January 2020) and UK lockdown (23rd March 2020) are shown with a bold vertical line. AMI: acute myocardial infarction; STEMI: ST-elevation myocardial infarction; NSTEMI: non-ST elevation myocardial infarction
Patients hospitalised with AMI during the decline phase were younger (66.87 vs 68.69 years), more frequently male (69.6% vs 67.9%) and less frequently had diabetes (24.5% vs 28.1%) and cerebrovascular disease (7.1% vs 8.6%, Figure 2). They had a lower median creatinine concentrations, less frequently self-presented to hospital without making use of the Emergency Ambulance Service (11.4% vs 20.6%) and less frequently had pulmonary oedema (2.5% vs 4.4%, Figure 3). The proportion of patients followed-up by a cardiologist, receiving in-patient echocardiography and, referred for cardiac rehabilitation remained very high, as did the prescription of secondary prevention pharmacotherapies at the time of discharge from hospital (Figure 3). The median length of hospital stay decreased from 4 to 2 days, and all-cause mortality at 30 days remained stable (Figure 4).
Figure 2: Time series plot of daily hospitalisations with acute myocardial infarction between 3rd November 2019 and 30th June 2020 for baseline patient characteristics, by STEMI and NSTEMI
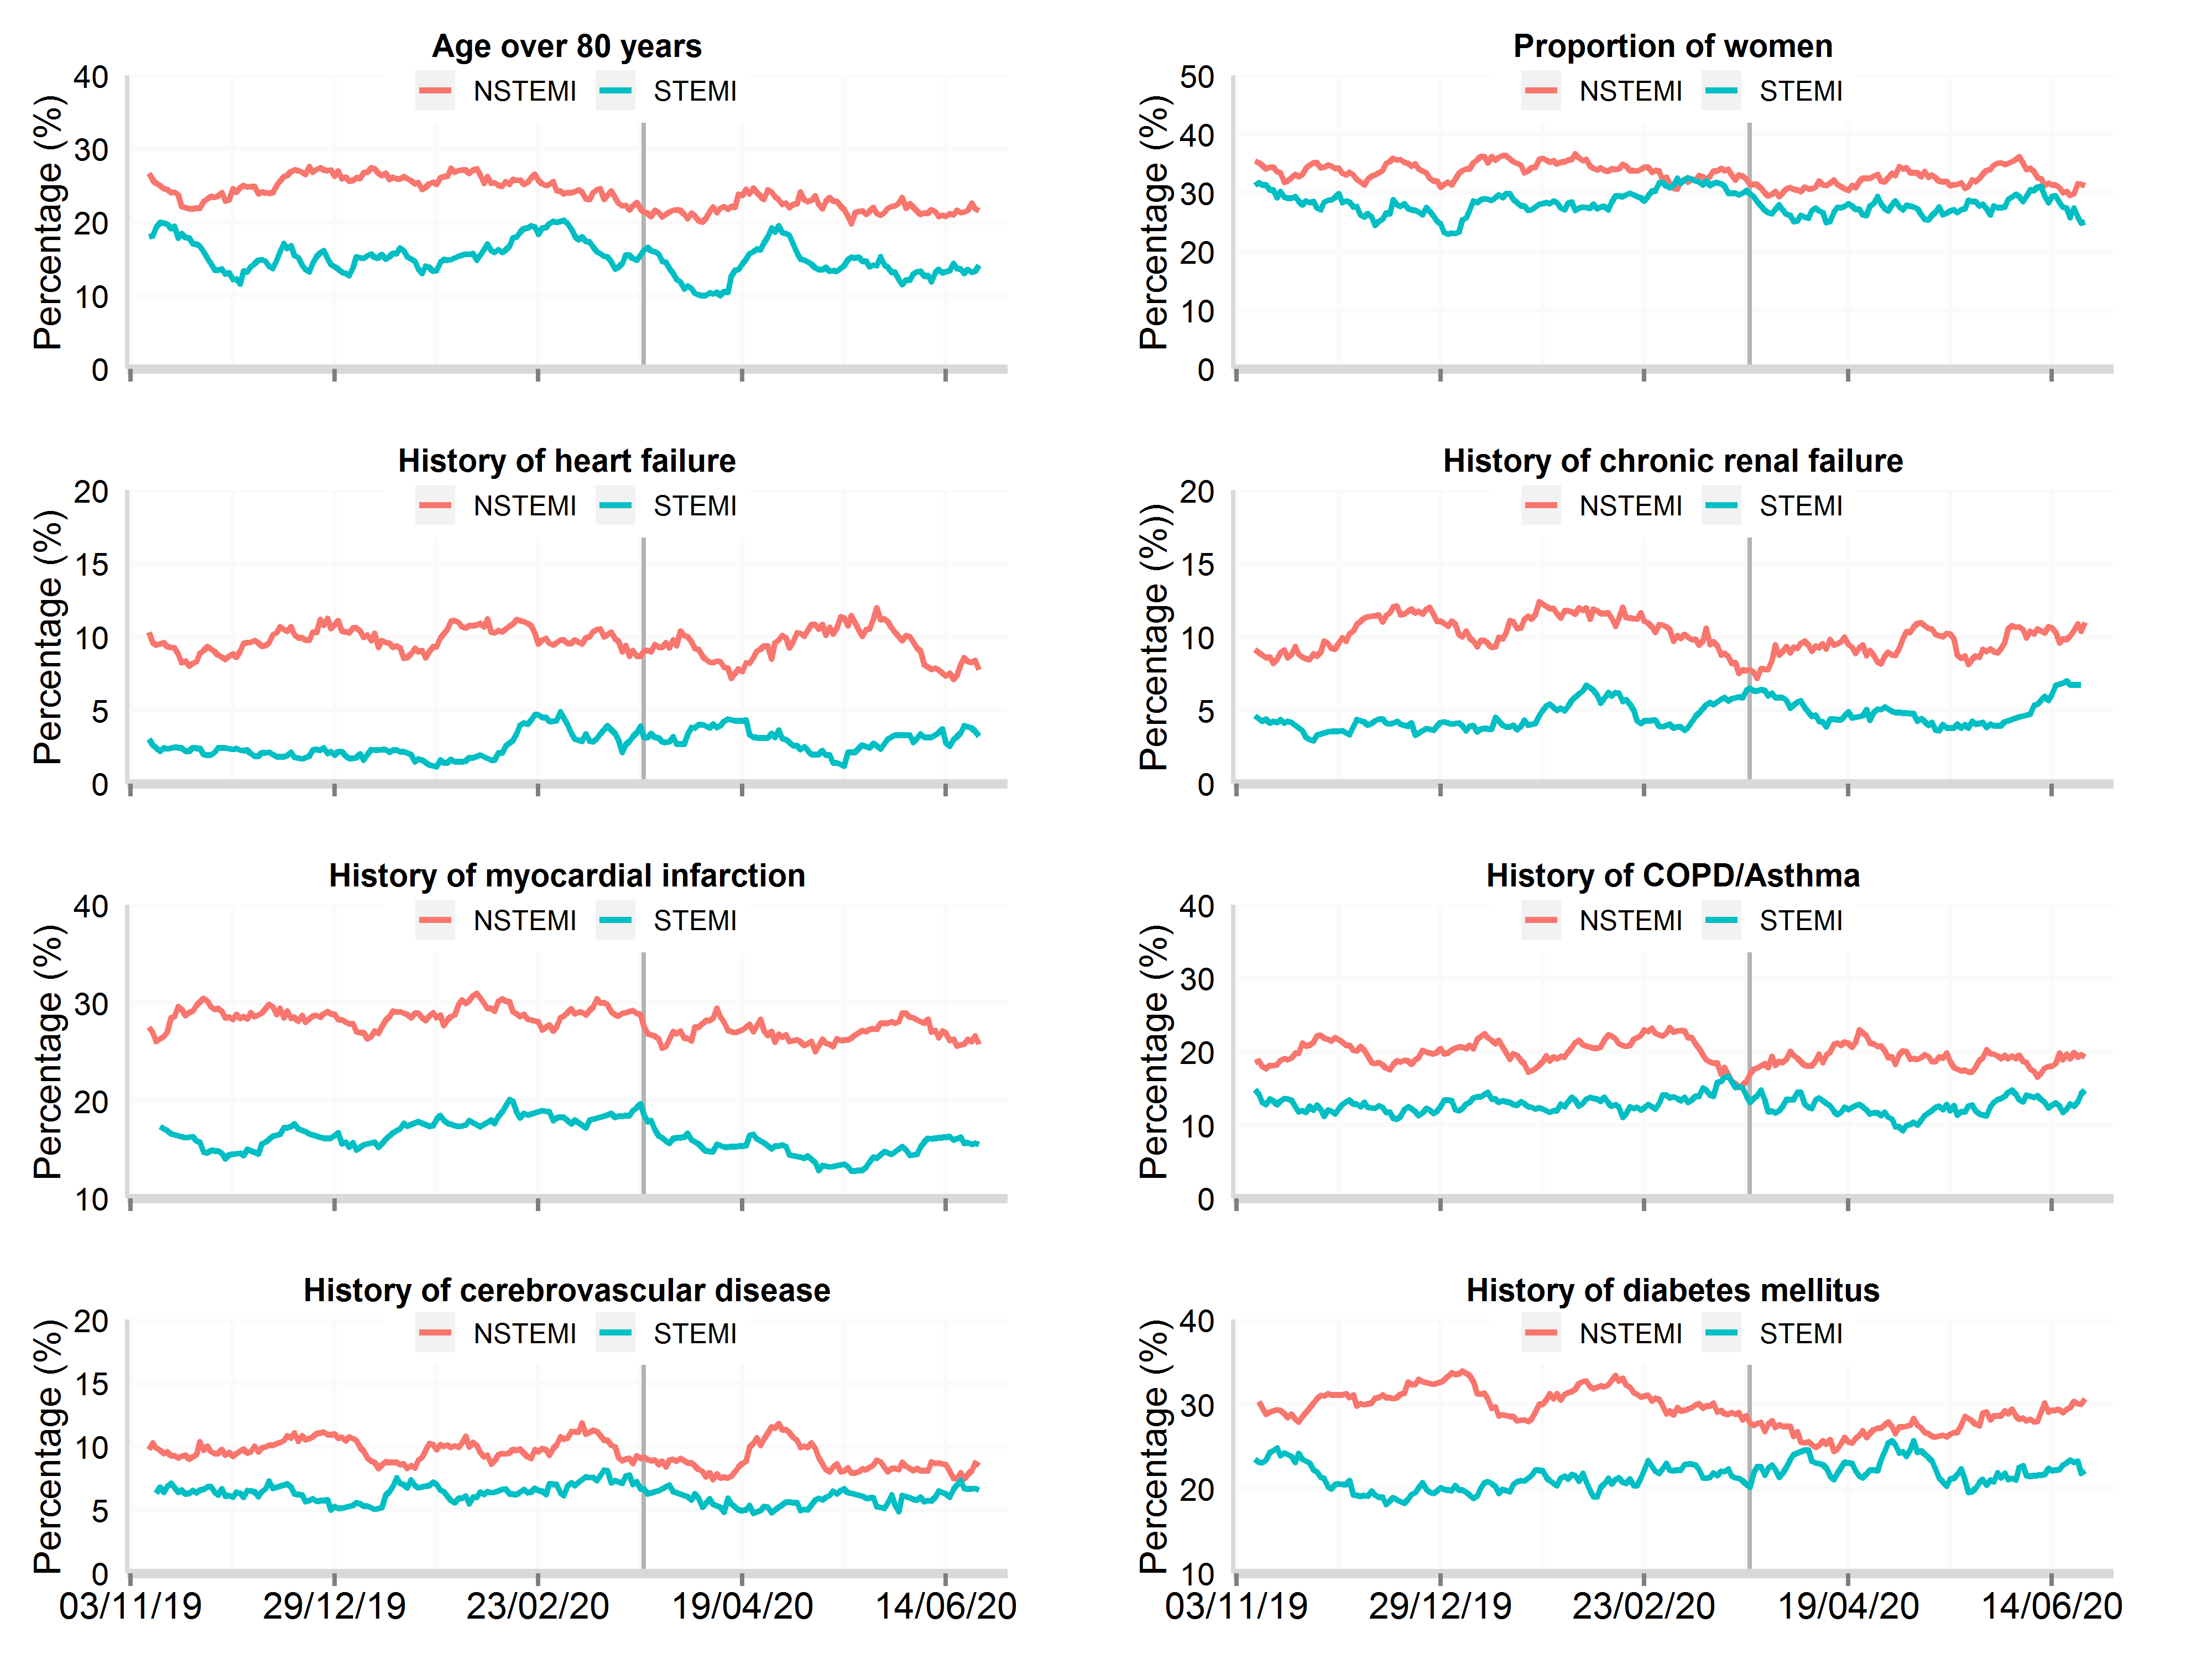
Data from 106 National Health Service hospitals in England with complete uploaded data up until 30th June 2020. Lines represent a 7-day simple moving average (indicating the mean number of daily admissions for that day and the preceding 6 days), adjusted for seasonality. The date of the COVID lockdown (23rd March 2020) is shown with a bold vertical line. STEMI: ST-elevation myocardial infarction; NSTEMI: non-ST elevation myocardial infarction
Figure 2: Time series plot of daily hospitalisations with acute myocardial infarction between 3rd November 2019 and 15th August 2020 for baseline patient characteristics, by STEMI and NSTEMI
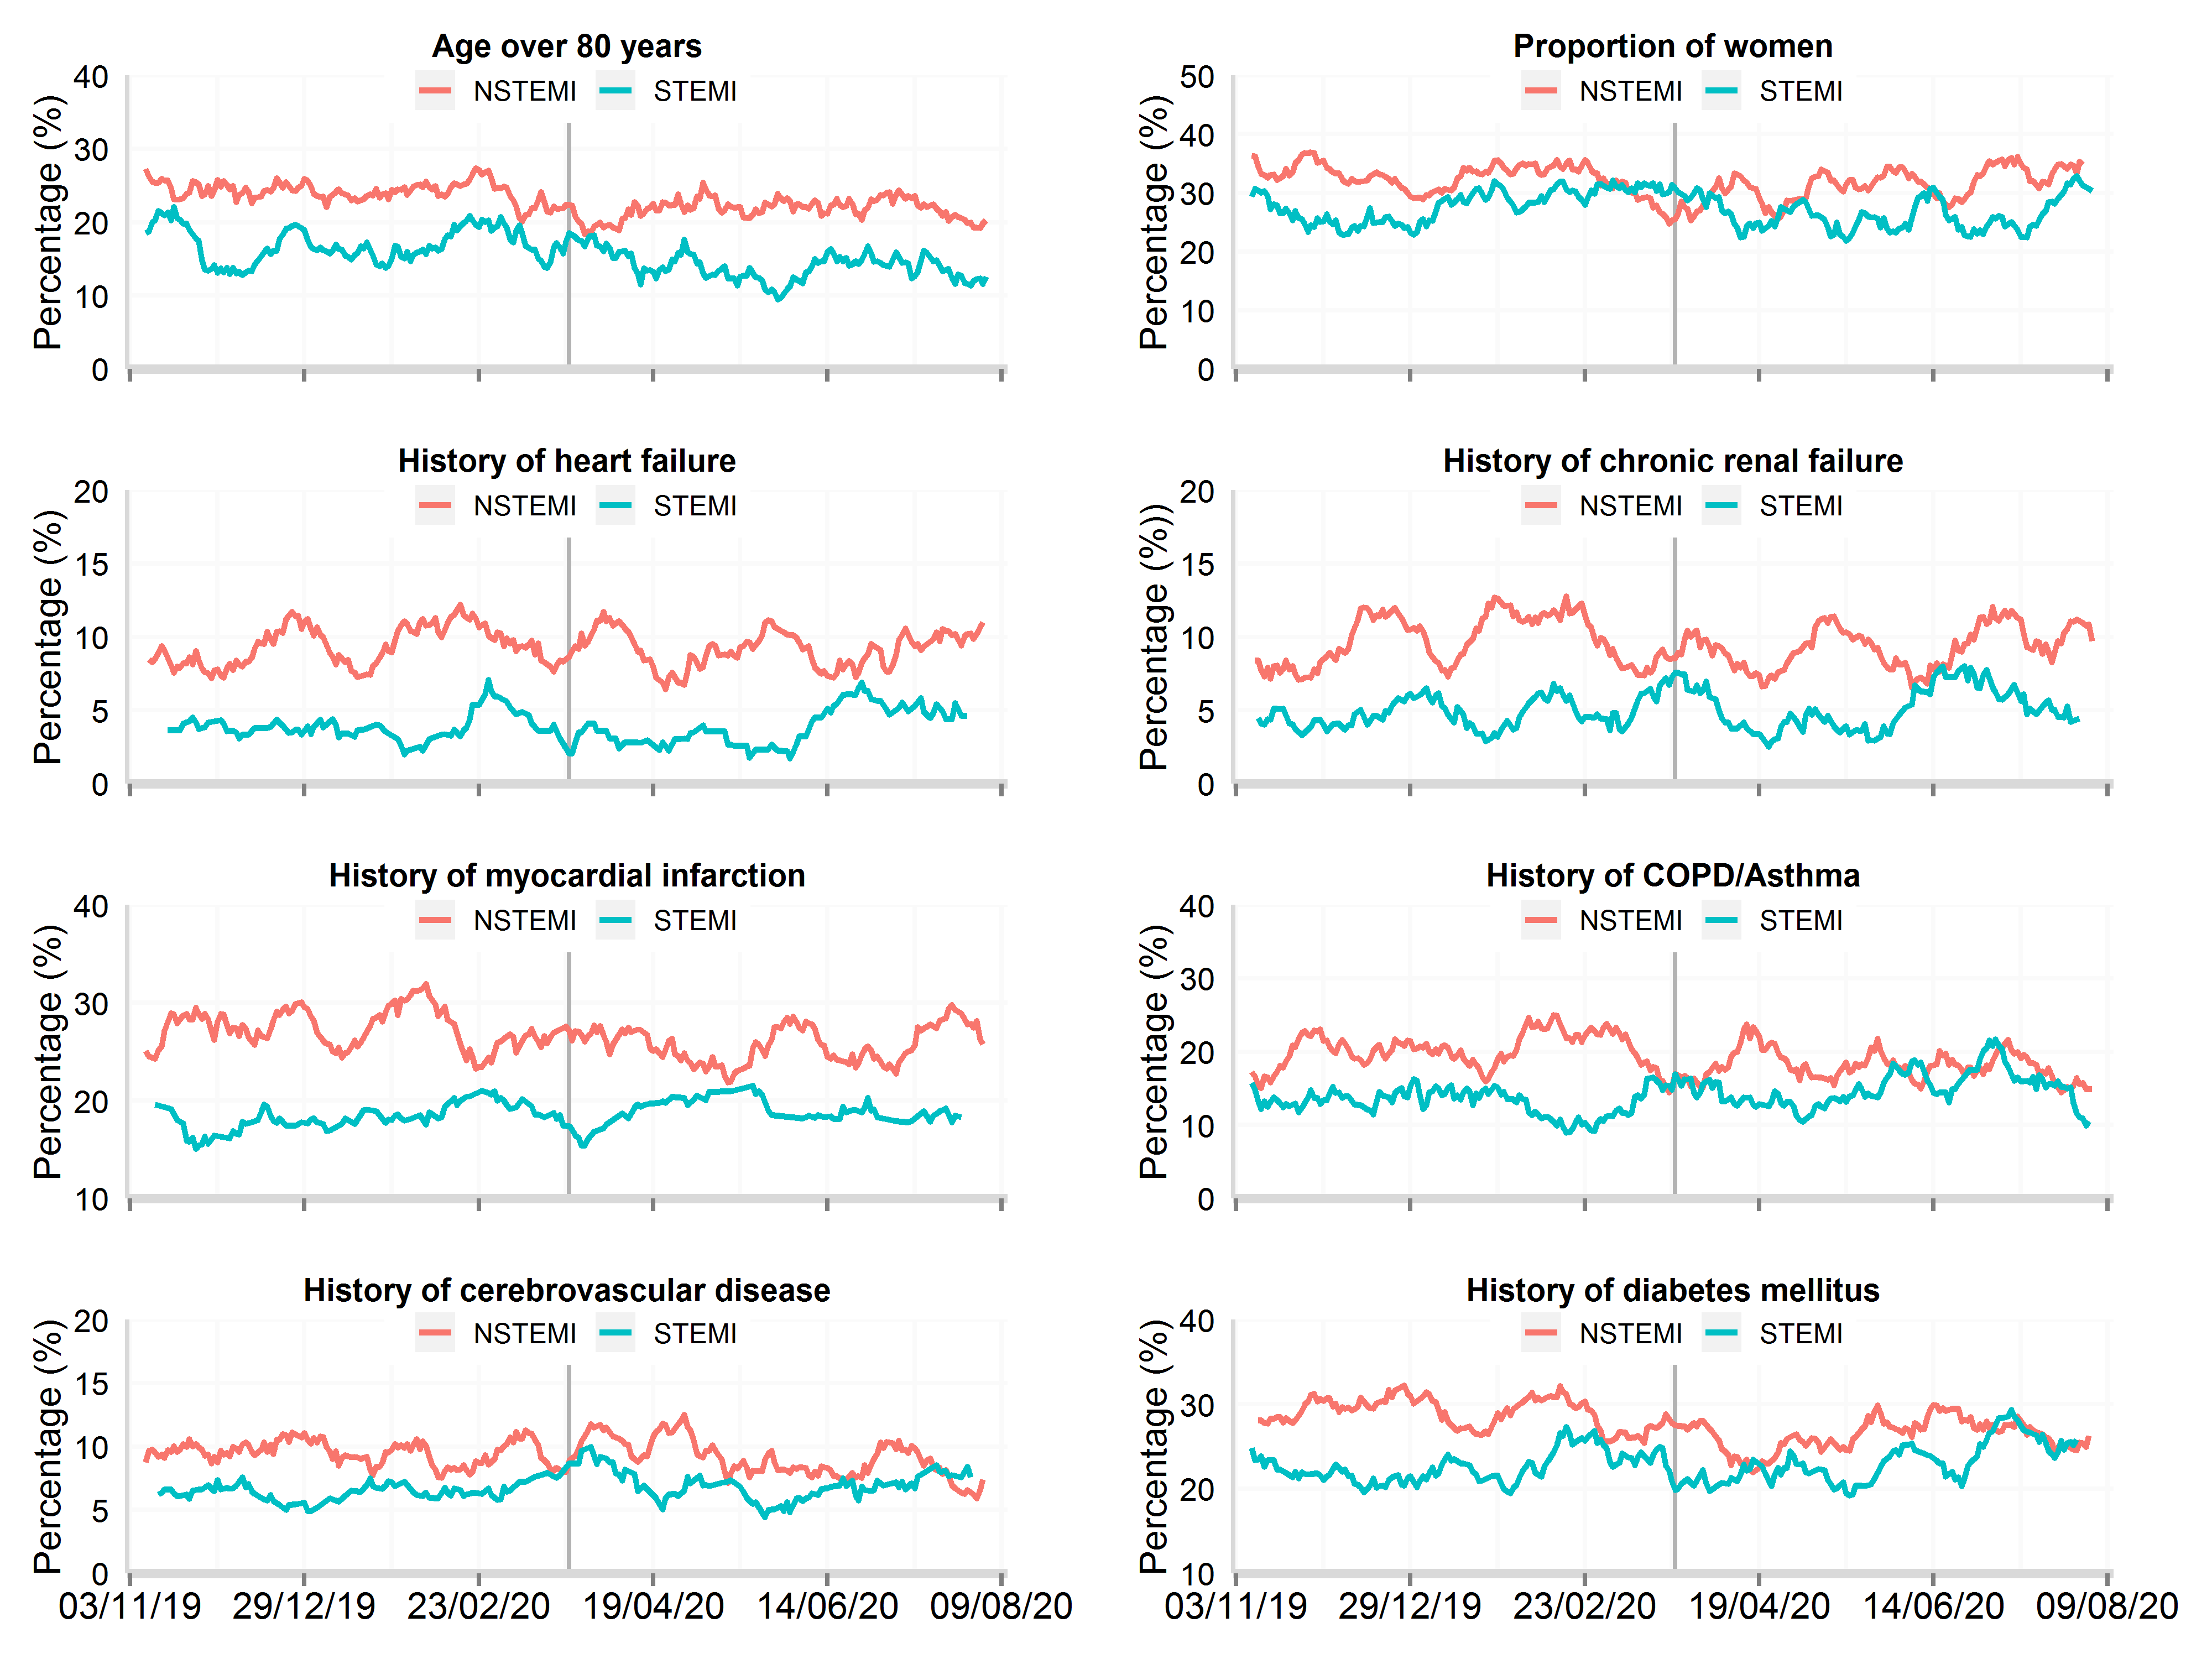
Data from 48 National Health Service hospitals in England with complete uploaded data up until 15th August 2020. Lines represent a 7-day simple moving average (indicating the mean number of daily admissions for that day and the preceding 6 days), adjusted for seasonality. AMI: acute myocardial infarction; STEMI: ST-elevation myocardial infarction; NSTEMI: non-ST elevation myocardial infarction
Figure 2: Time series plot of daily hospitalisations with acute myocardial infarction between 3rd November 2019 and 30th September 2020 for baseline patient characteristics, by STEMI and NSTEMI (updated 11th November 2020)
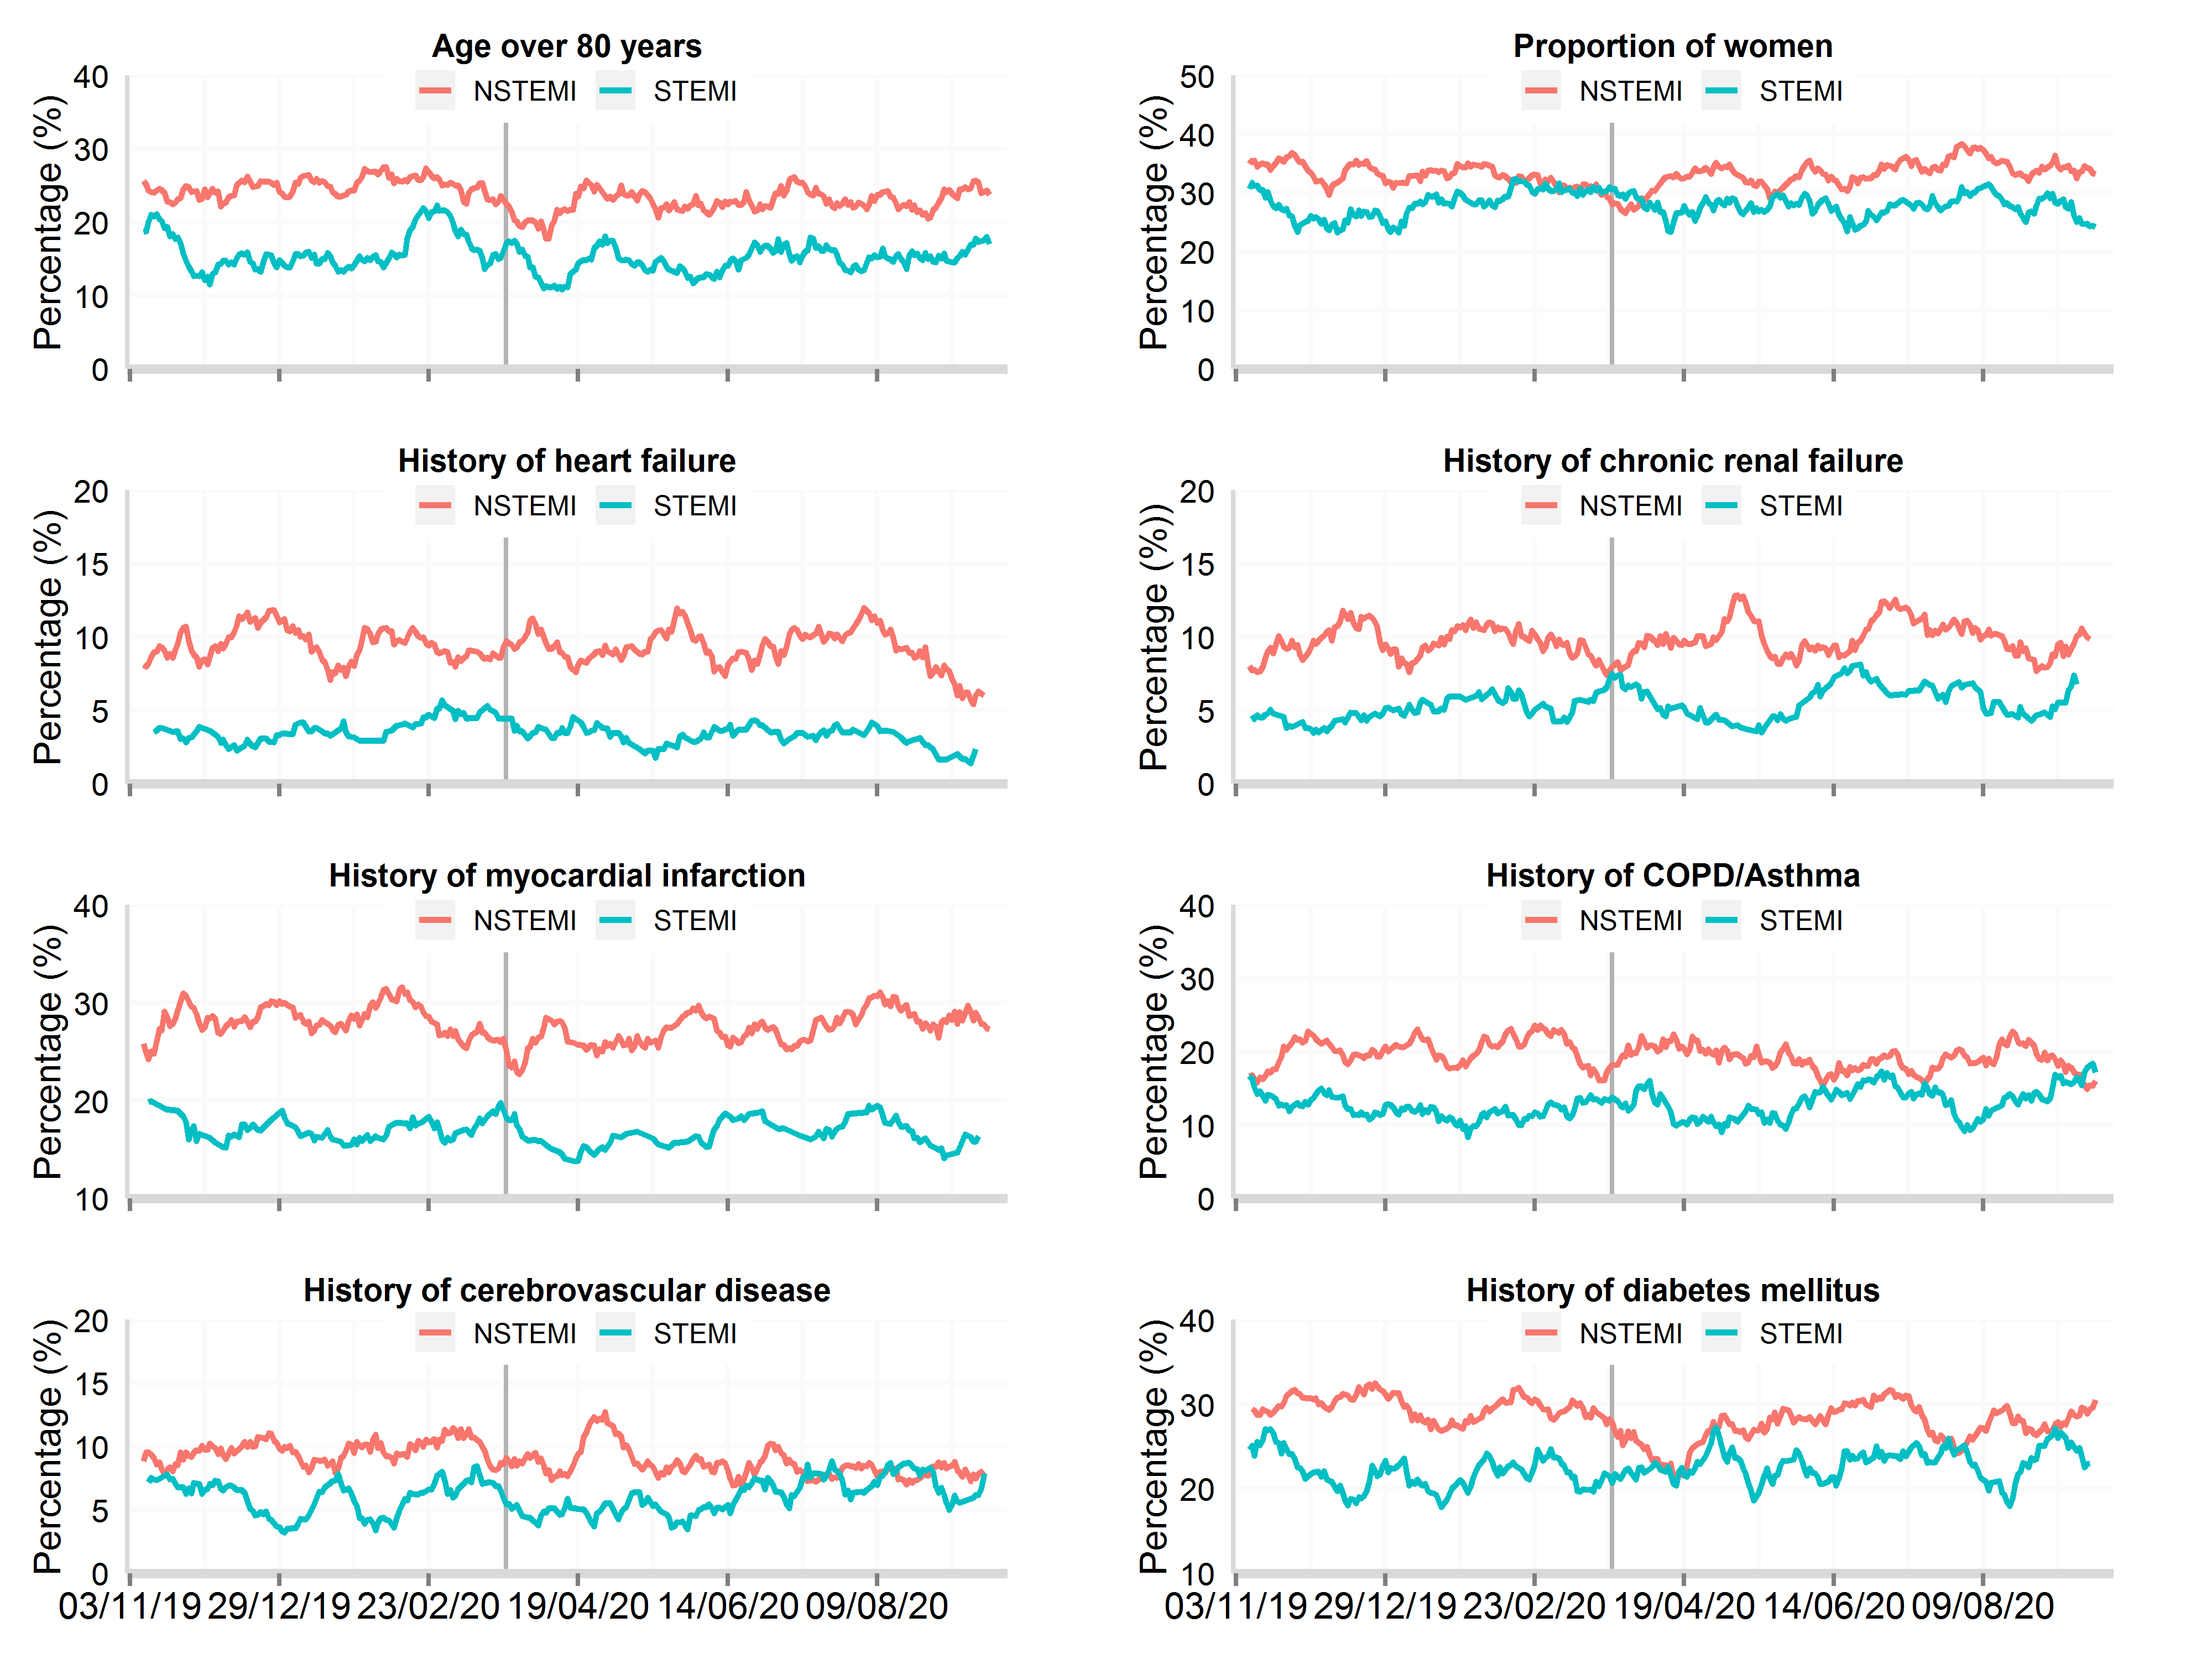
Data from 81 National Health Service hospitals in England with complete uploaded data up until 30th September 2020. Lines represent a 7-day simple moving average (indicating the mean number of daily admissions for that day and the preceding 6 days), adjusted for seasonality. AMI: acute myocardial infarction; STEMI: ST-elevation myocardial infarction; NSTEMI: non-ST elevation myocardial infarction
Figure 2: Time series plot of daily hospitalisations with acute myocardial infarction between 3rd November 2019 and 8th December 2020 for baseline patient characteristics, by STEMI and NSTEMI (updated 11th Feb 2021)
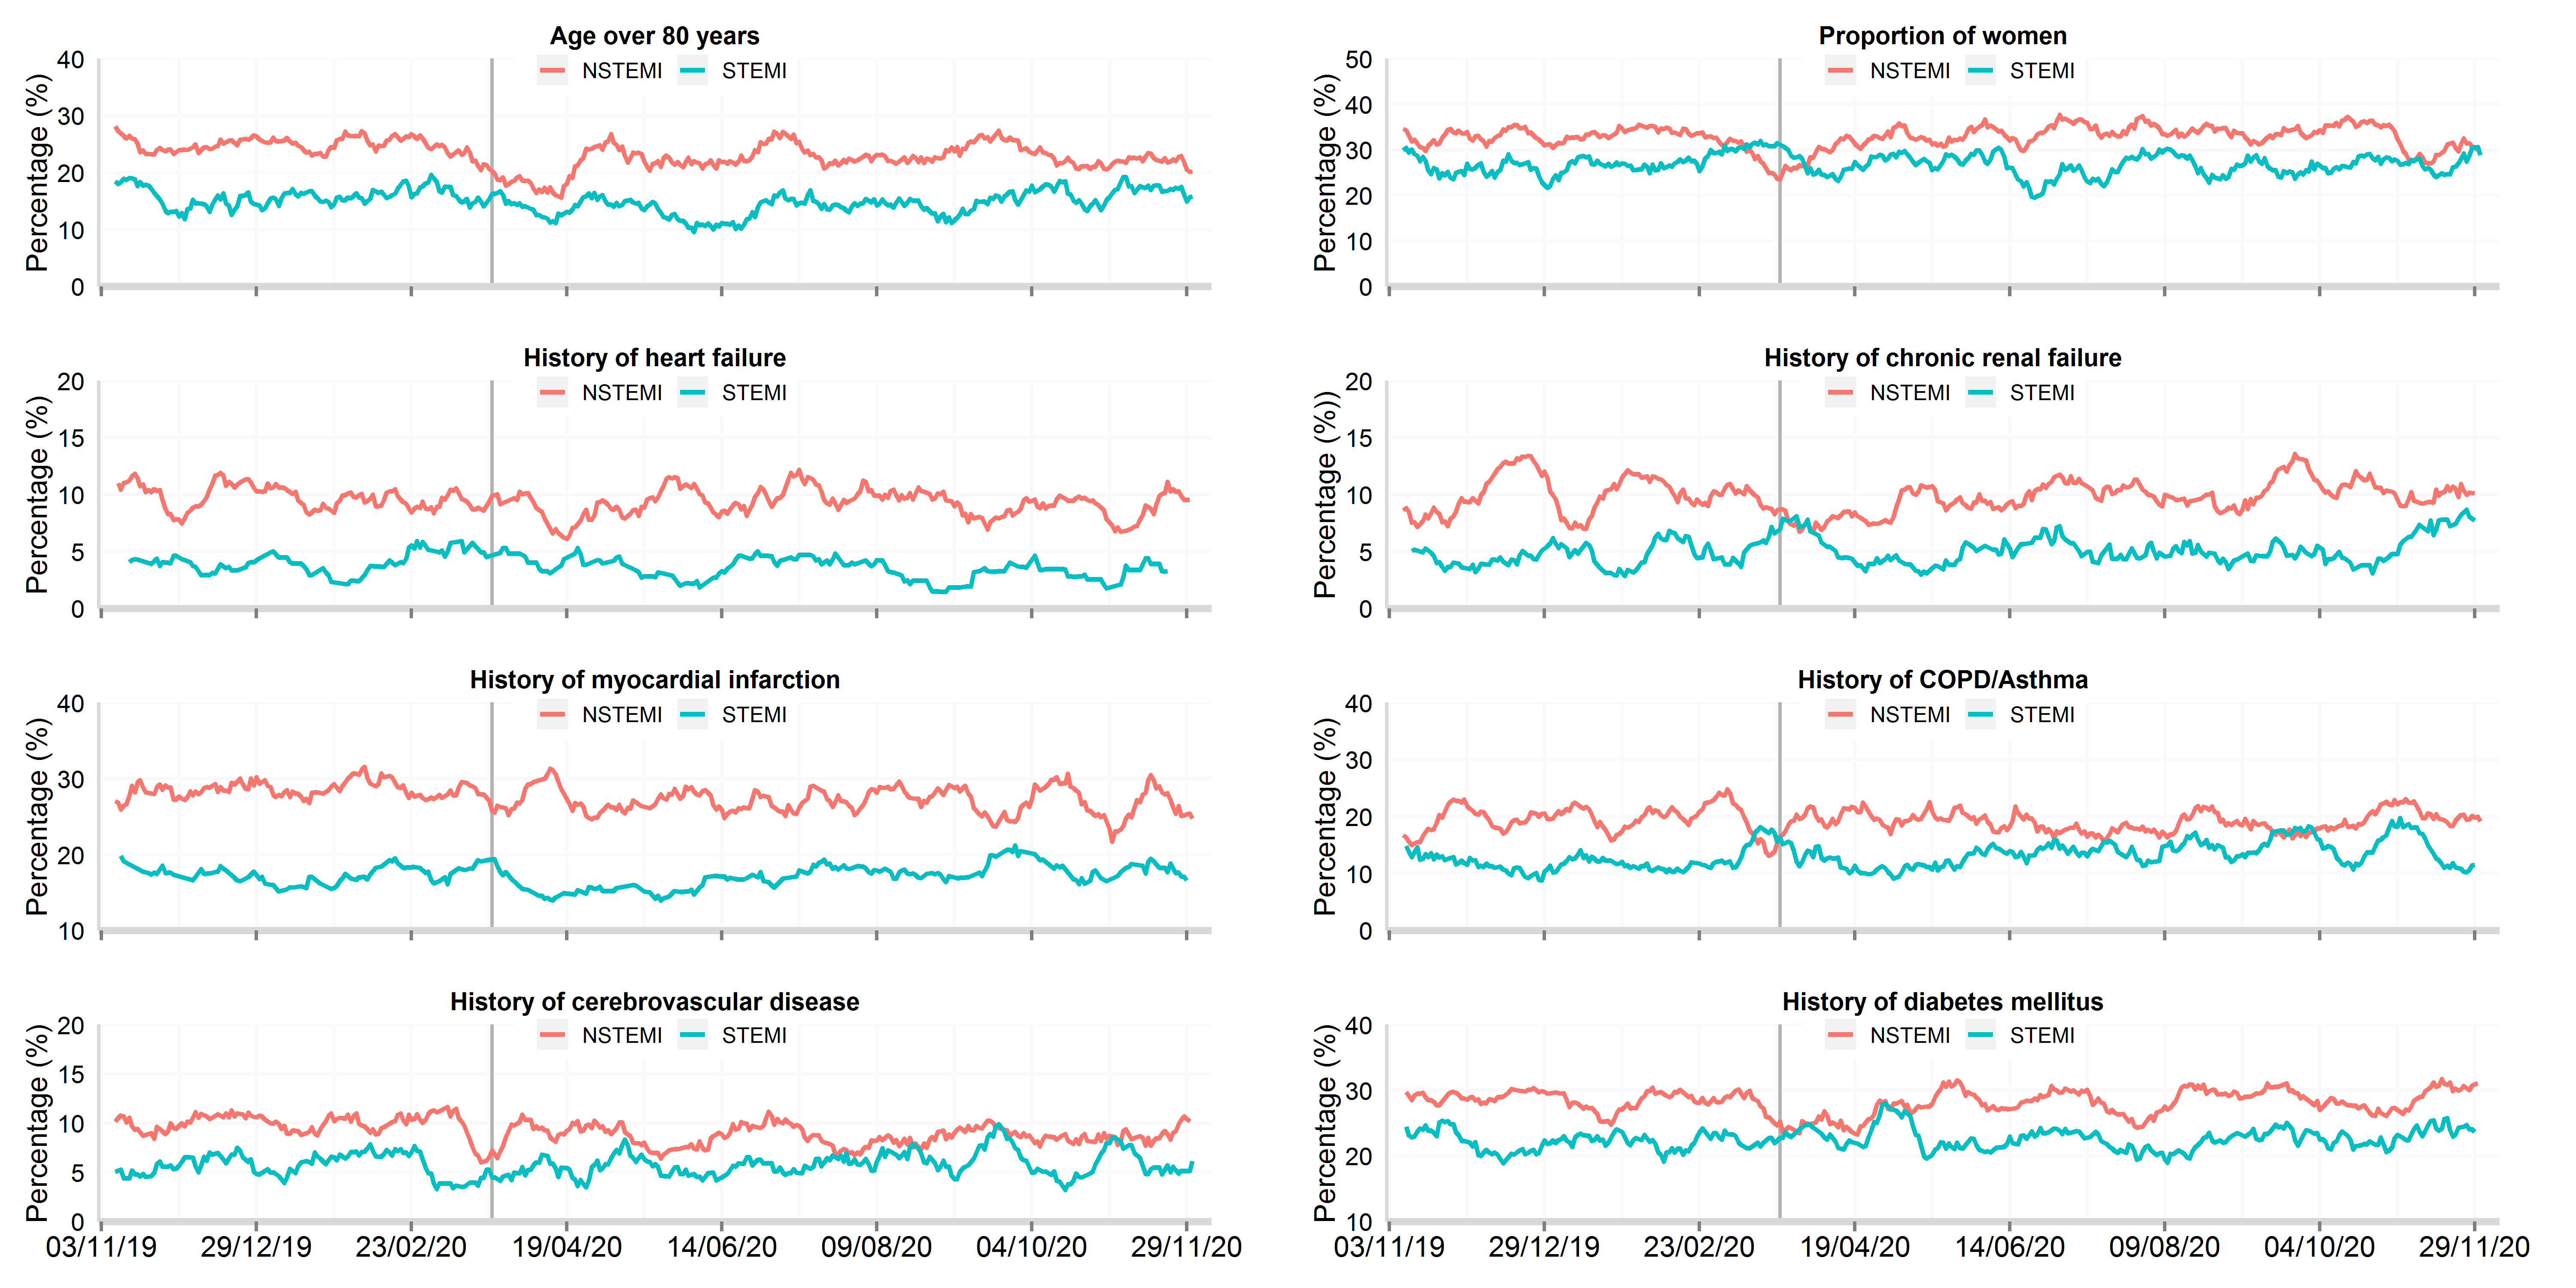
Data from 66 National Health Service hospitals in England with complete uploaded data up until 8th December 2020. Lines represent a 7-day simple moving average (indicating the mean number of daily admissions for that day and the preceding 6 days), adjusted for seasonality. AMI: acute myocardial infarction; STEMI: ST-elevation myocardial infarction; NSTEMI: non-ST elevation myocardial infarction
During the recovery phase (20th April to 30th June 2020), the patient characteristics of admission with AMI were similar to those of patients in the decline phase (Figure 2). However, there was a partial return to pre-lockdown rates for self-presentations with AMI to hospitals (16.7% vs 20.6%) and those with pulmonary oedema (3.7% vs 4.4%, Table 2). The proportion of patients seen by a cardiologist, receiving in-patient echocardiography, referred for cardiac rehabilitation, and use of secondary prevention therapies each remained very high (Figure 3). The median length of hospital stay increased to 3 days (Figure 3), and all-cause mortality at 30 days remained stable (Figure 4).
Figure 3: Time series plot of daily hospitalisations with acute myocardial infarction between 3rd November 2019 and 30th June 2020 for patient response and hospital treatments, by STEMI and NSTEMI
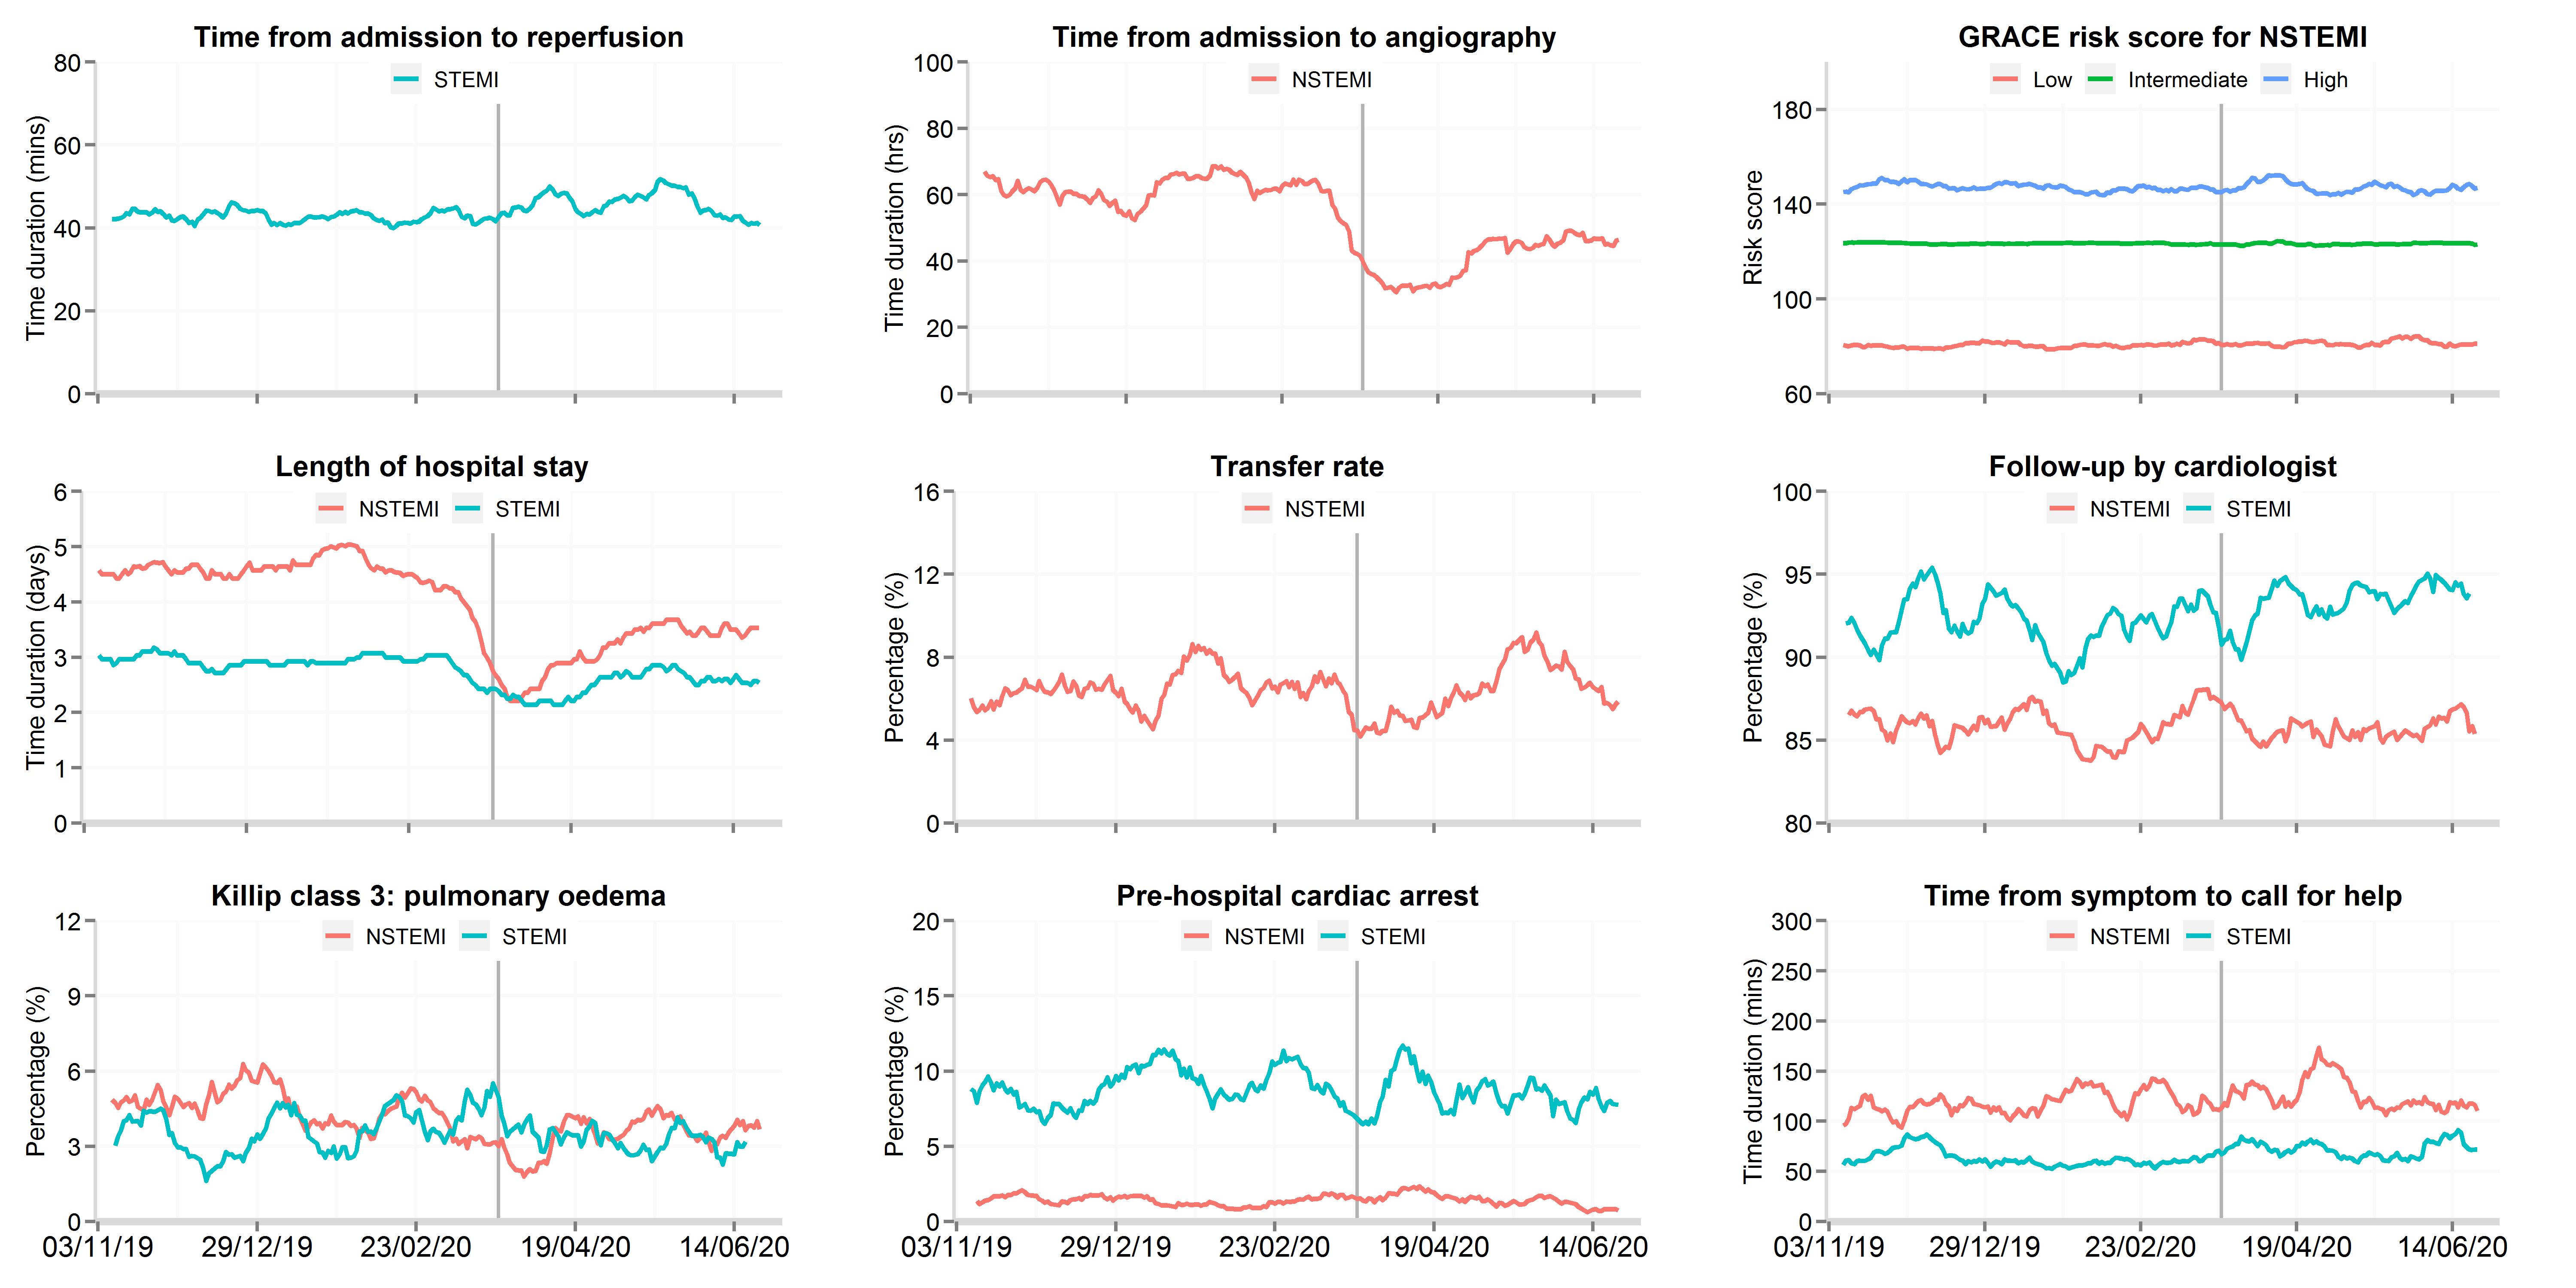
Data from 106 National Health Service hospitals in England with complete uploaded data up until 30th June 2020. Lines represent a 7-day simple moving average (indicating the mean number of daily admissions for that day and the preceding 6 days), adjusted for seasonality. The date of the COVID lockdown (23rd March 2020) is shown with a bold vertical line. Symptom to call-for help data are only for patients who presented to hospital by ambulance. Transfer rate refers to the proportion of patients hospitalised with NSTEMI where were transferred between hospitals for an invasive coronary strategy. STEMI: ST-elevation myocardial infarction; NSTEMI: non-ST elevation myocardial infarction.
Figure 3: Time series plot of daily hospitalisations with acute myocardial infarction between 3rd November 2019 and 15th August 2020 for patient response and hospital treatments, by STEMI and NSTEMI
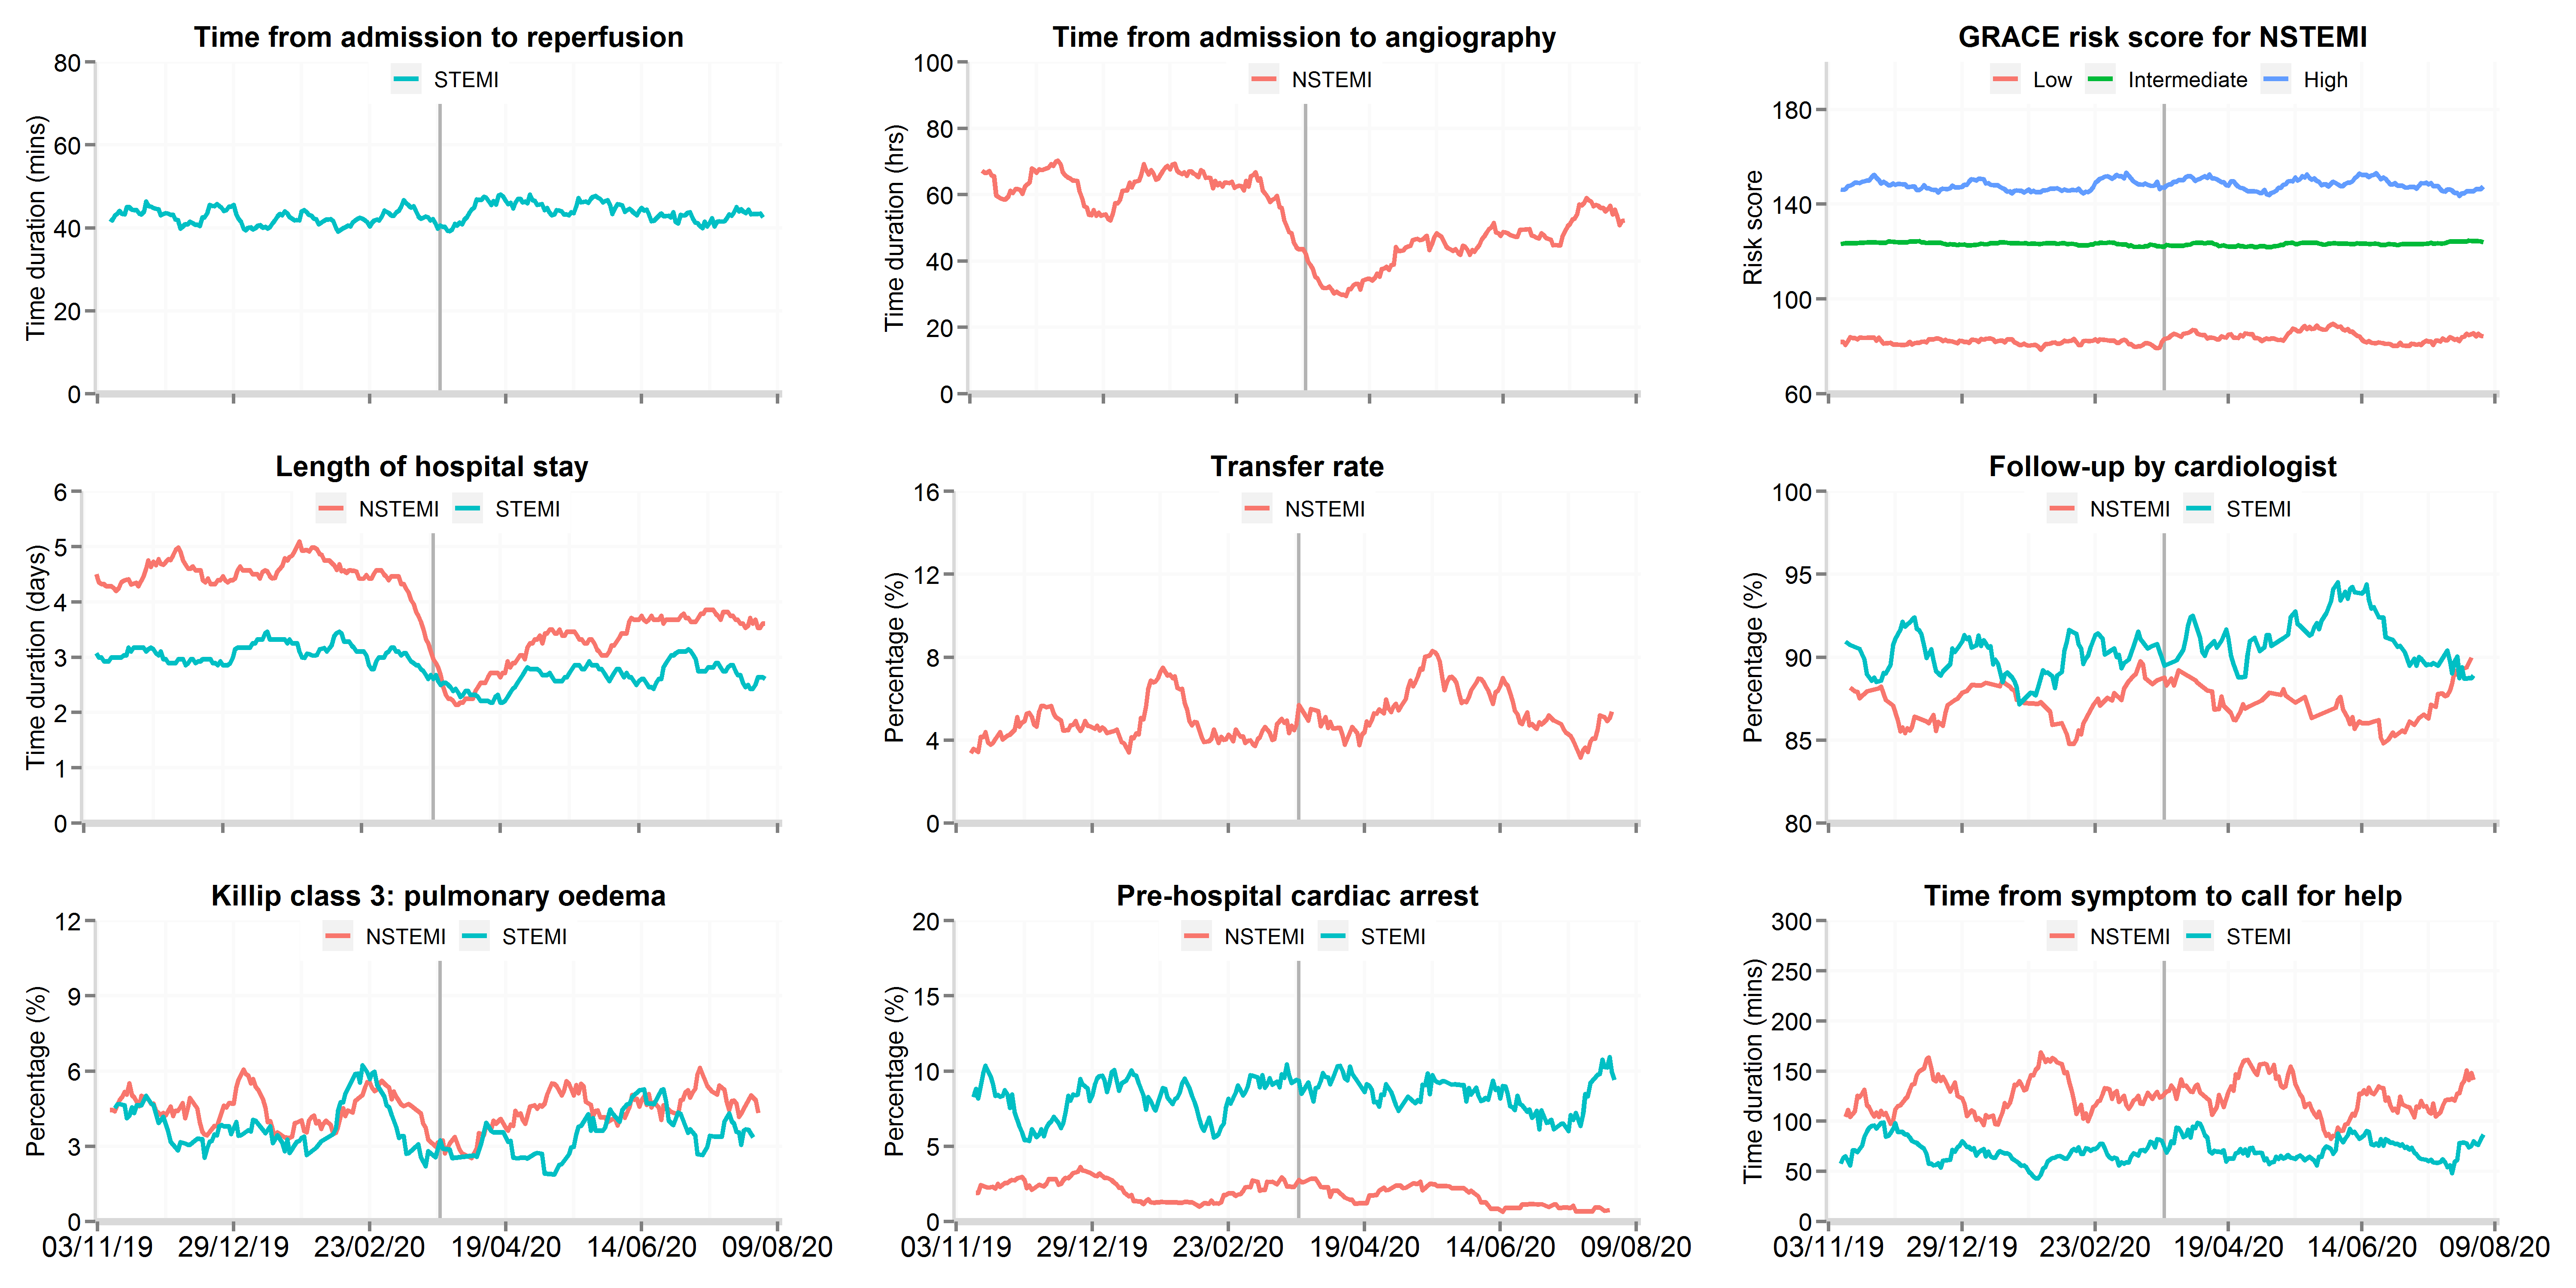
Data from 48 National Health Service hospitals in England with complete uploaded data up until 15th August 2020. Lines represent a 7-day simple moving average (indicating the mean number of daily admissions for that day and the preceding 6 days), adjusted for seasonality. The date of the COVID lockdown (23rd March 2020) is shown with a bold vertical line. Symptom to call-for help data are only for patients who presented to hospital by ambulance. Transfer rate refers to the proportion of patients hospitalised with NSTEMI where were transferred between hospitals for an invasive coronary strategy. STEMI: ST-elevation myocardial infarction; NSTEMI: non-ST elevation myocardial infarction.
Figure 3: Time series plot of daily hospitalisations with acute myocardial infarction between 3rd November 2019 and 30th September 2020 for patient response and hospital treatments, by STEMI and NSTEMI (updated 11th November 2020)
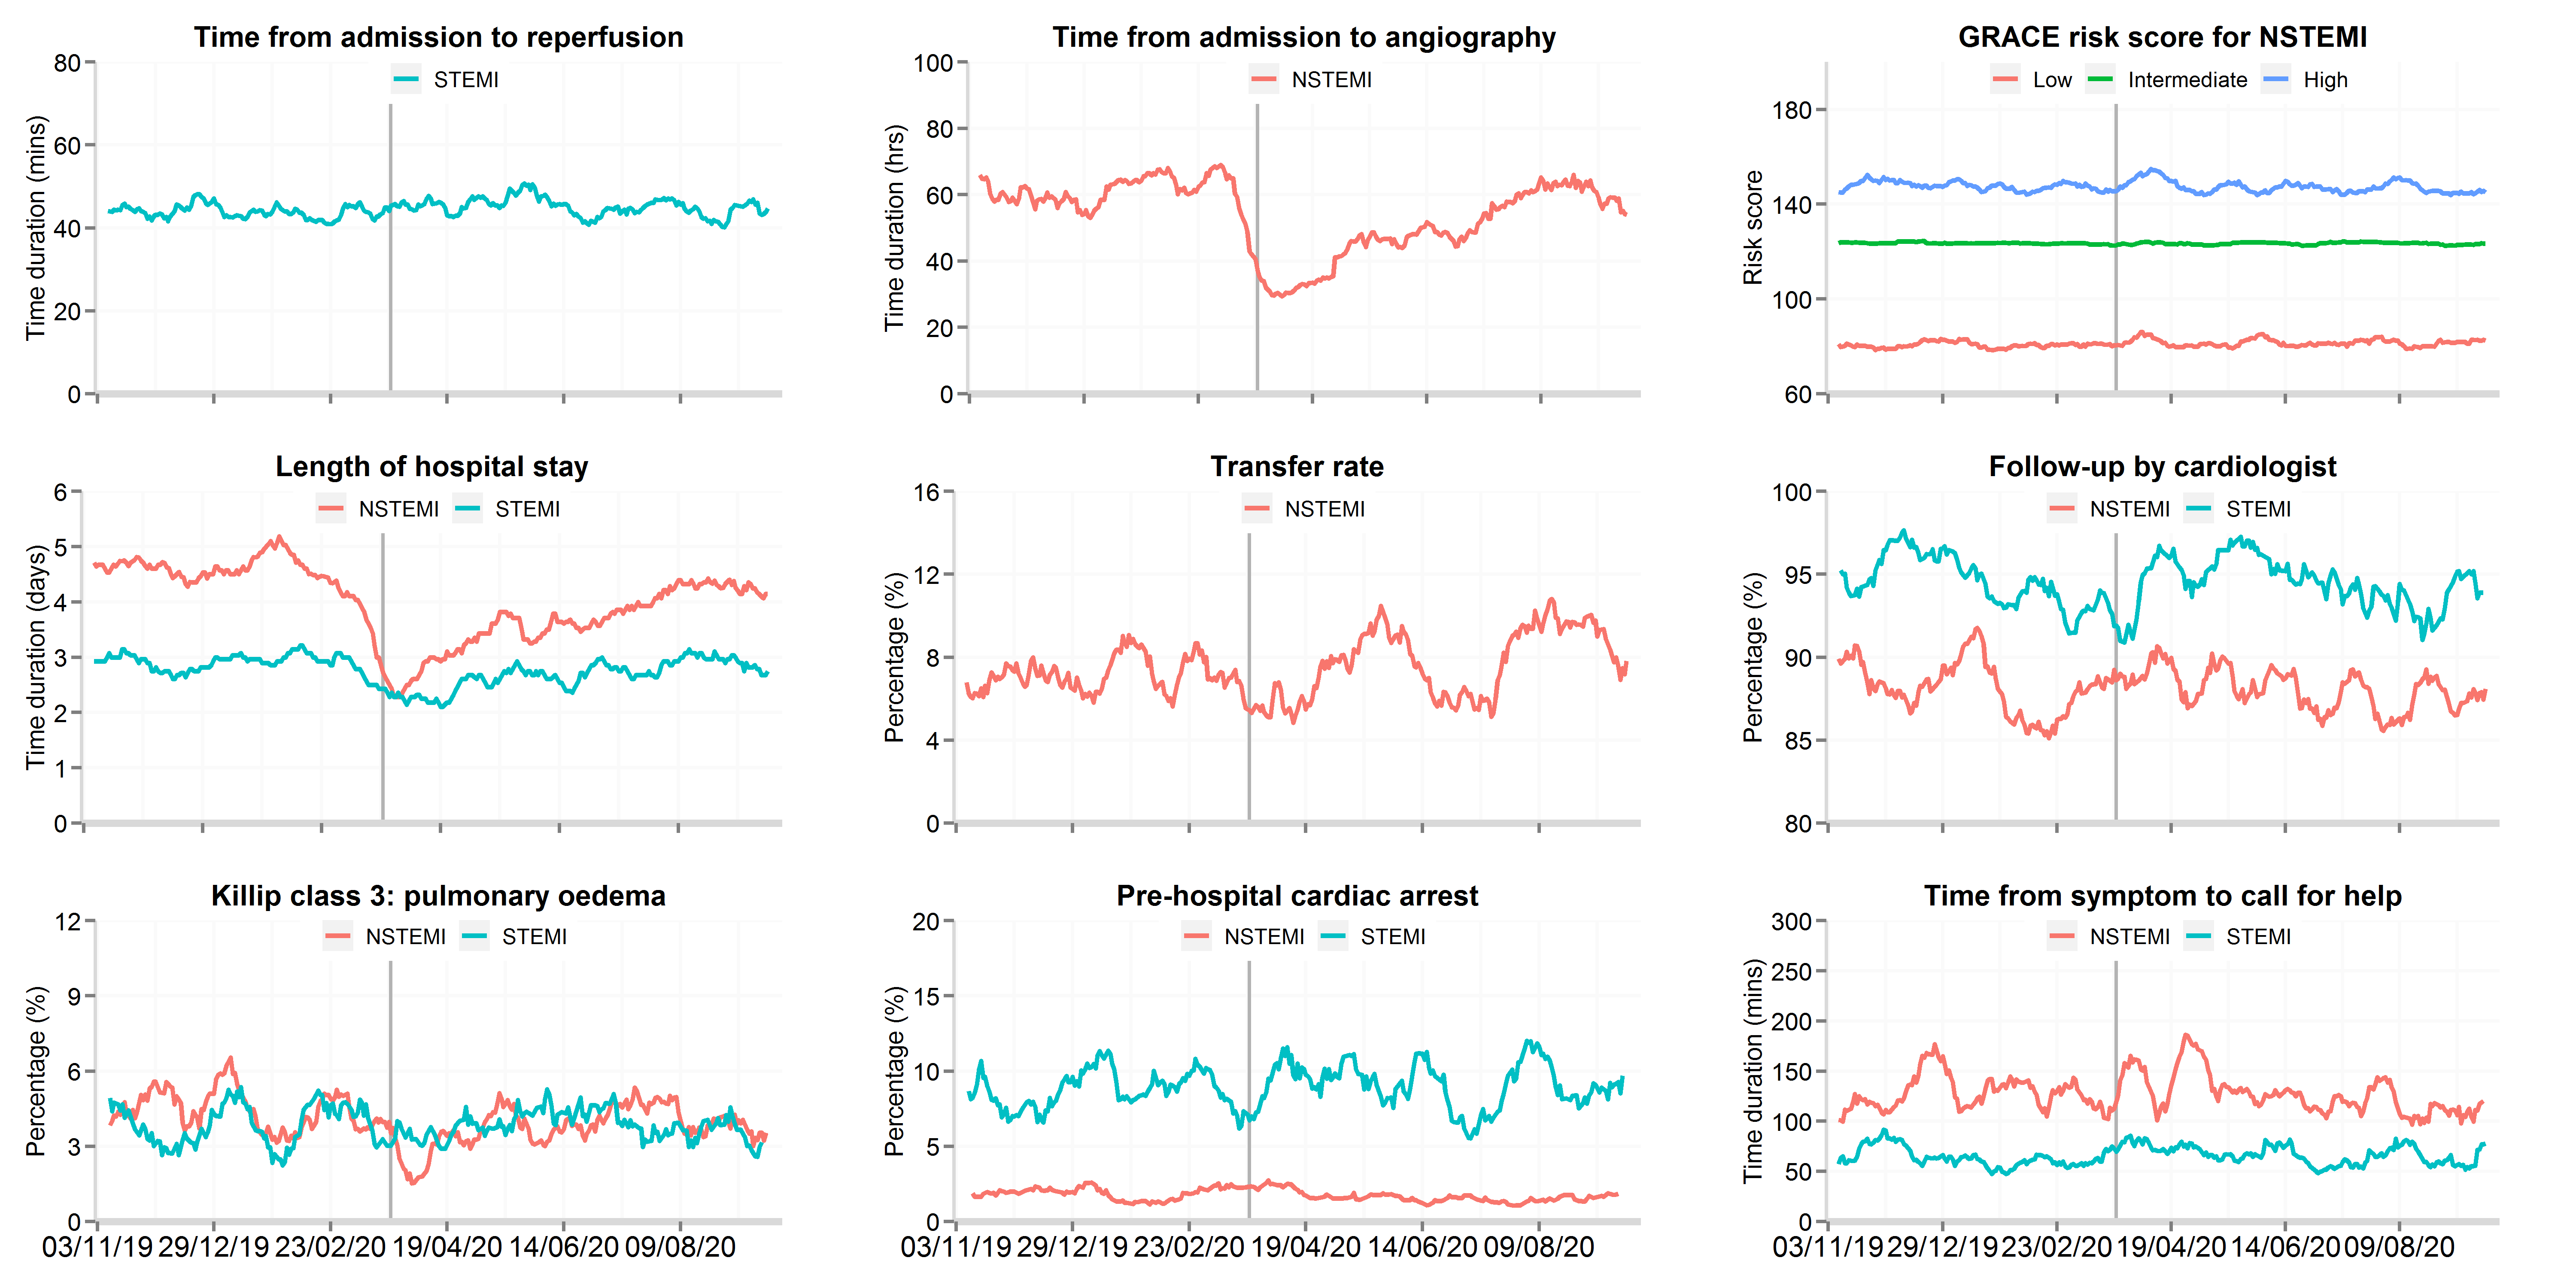
Data from 81 National Health Service hospitals in England with complete uploaded data up until 30th September 2020. Lines represent a 7-day simple moving average (indicating the mean number of daily admissions for that day and the preceding 6 days), adjusted for seasonality. The date of the COVID lockdown (23rd March 2020) is shown with a bold vertical line. Symptom to call-for help data are only for patients who presented to hospital by ambulance. Transfer rate refers to the proportion of patients hospitalised with NSTEMI where were transferred between hospitals for an invasive coronary strategy. STEMI: ST-elevation myocardial infarction; NSTEMI: non-ST elevation myocardial infarction.
Figure 3: Time series plot of daily hospitalisations with acute myocardial infarction between 3rd November 2019 and 8th December 2020 for patient response and hospital treatments, by STEMI and NSTEMI (updated 11th Feb 2021)
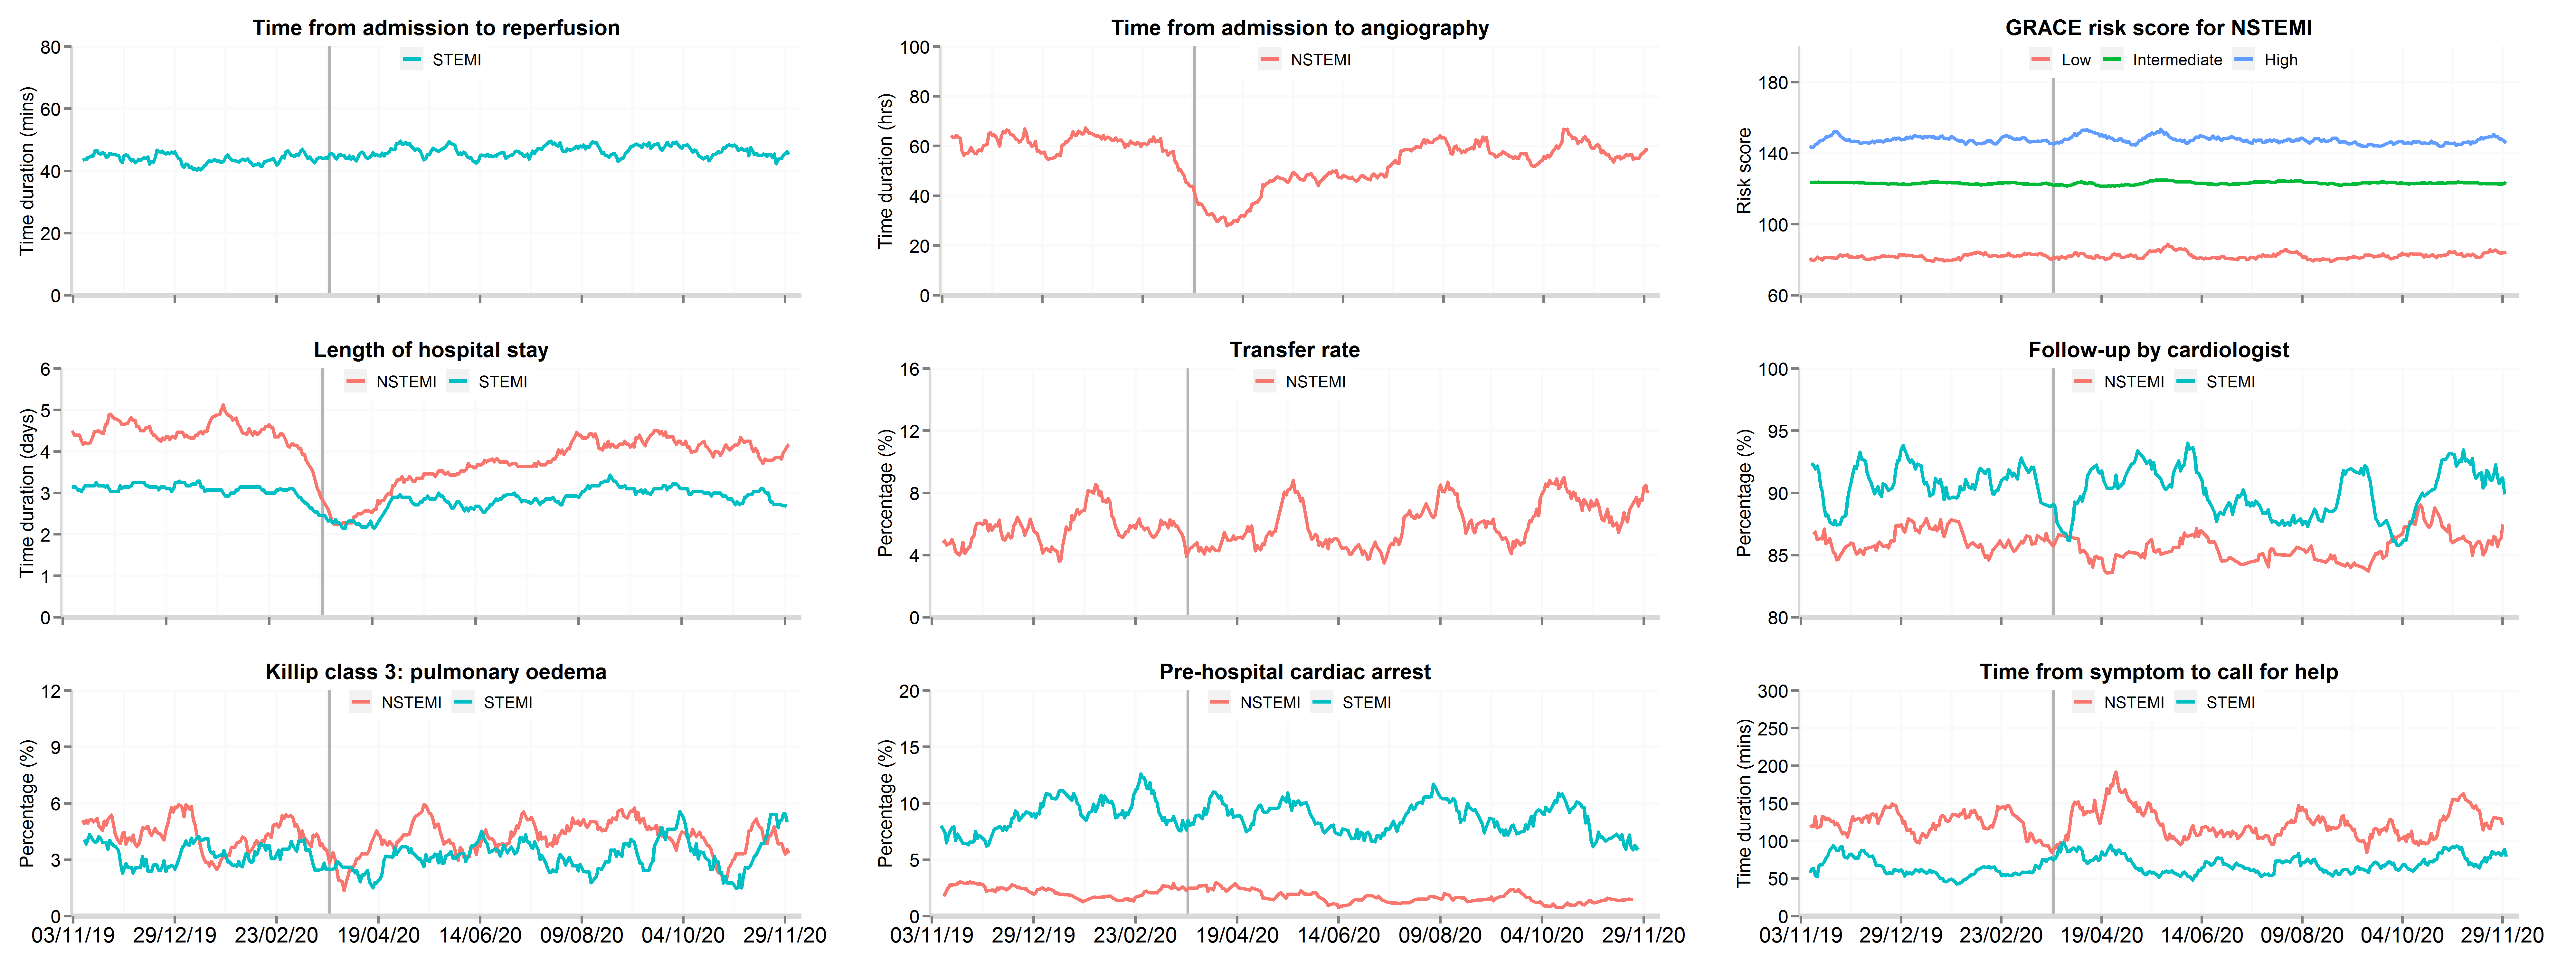
Data from 66 National Health Service hospitals in England with complete uploaded data up until 8th December 2020. Lines represent a 7-day simple moving average (indicating the mean number of daily admissions for that day and the preceding 6 days), adjusted for seasonality. The date of the COVID lockdown (23rd March 2020) is shown with a bold vertical line. Symptom to call-for help data are only for patients who presented to hospital by ambulance. Transfer rate refers to the proportion of patients hospitalised with NSTEMI where were transferred between hospitals for an invasive coronary strategy. STEMI: ST-elevation myocardial infarction; NSTEMI: non-ST elevation myocardial infarction.Patients with STEMI
There was a 28.6% decrease to a nadir on 19th April in the number of hospitalisations with STEMI representing a decline in the median daily number of admission from 35 to 25 (IRR 0.74, 95% CI 0.69 to 0.80), and remain stable in recovery phase.
Figure 4: 30-day all-cause mortality between 3rd November 2019 and 30th June 2020, by study period and AMI type
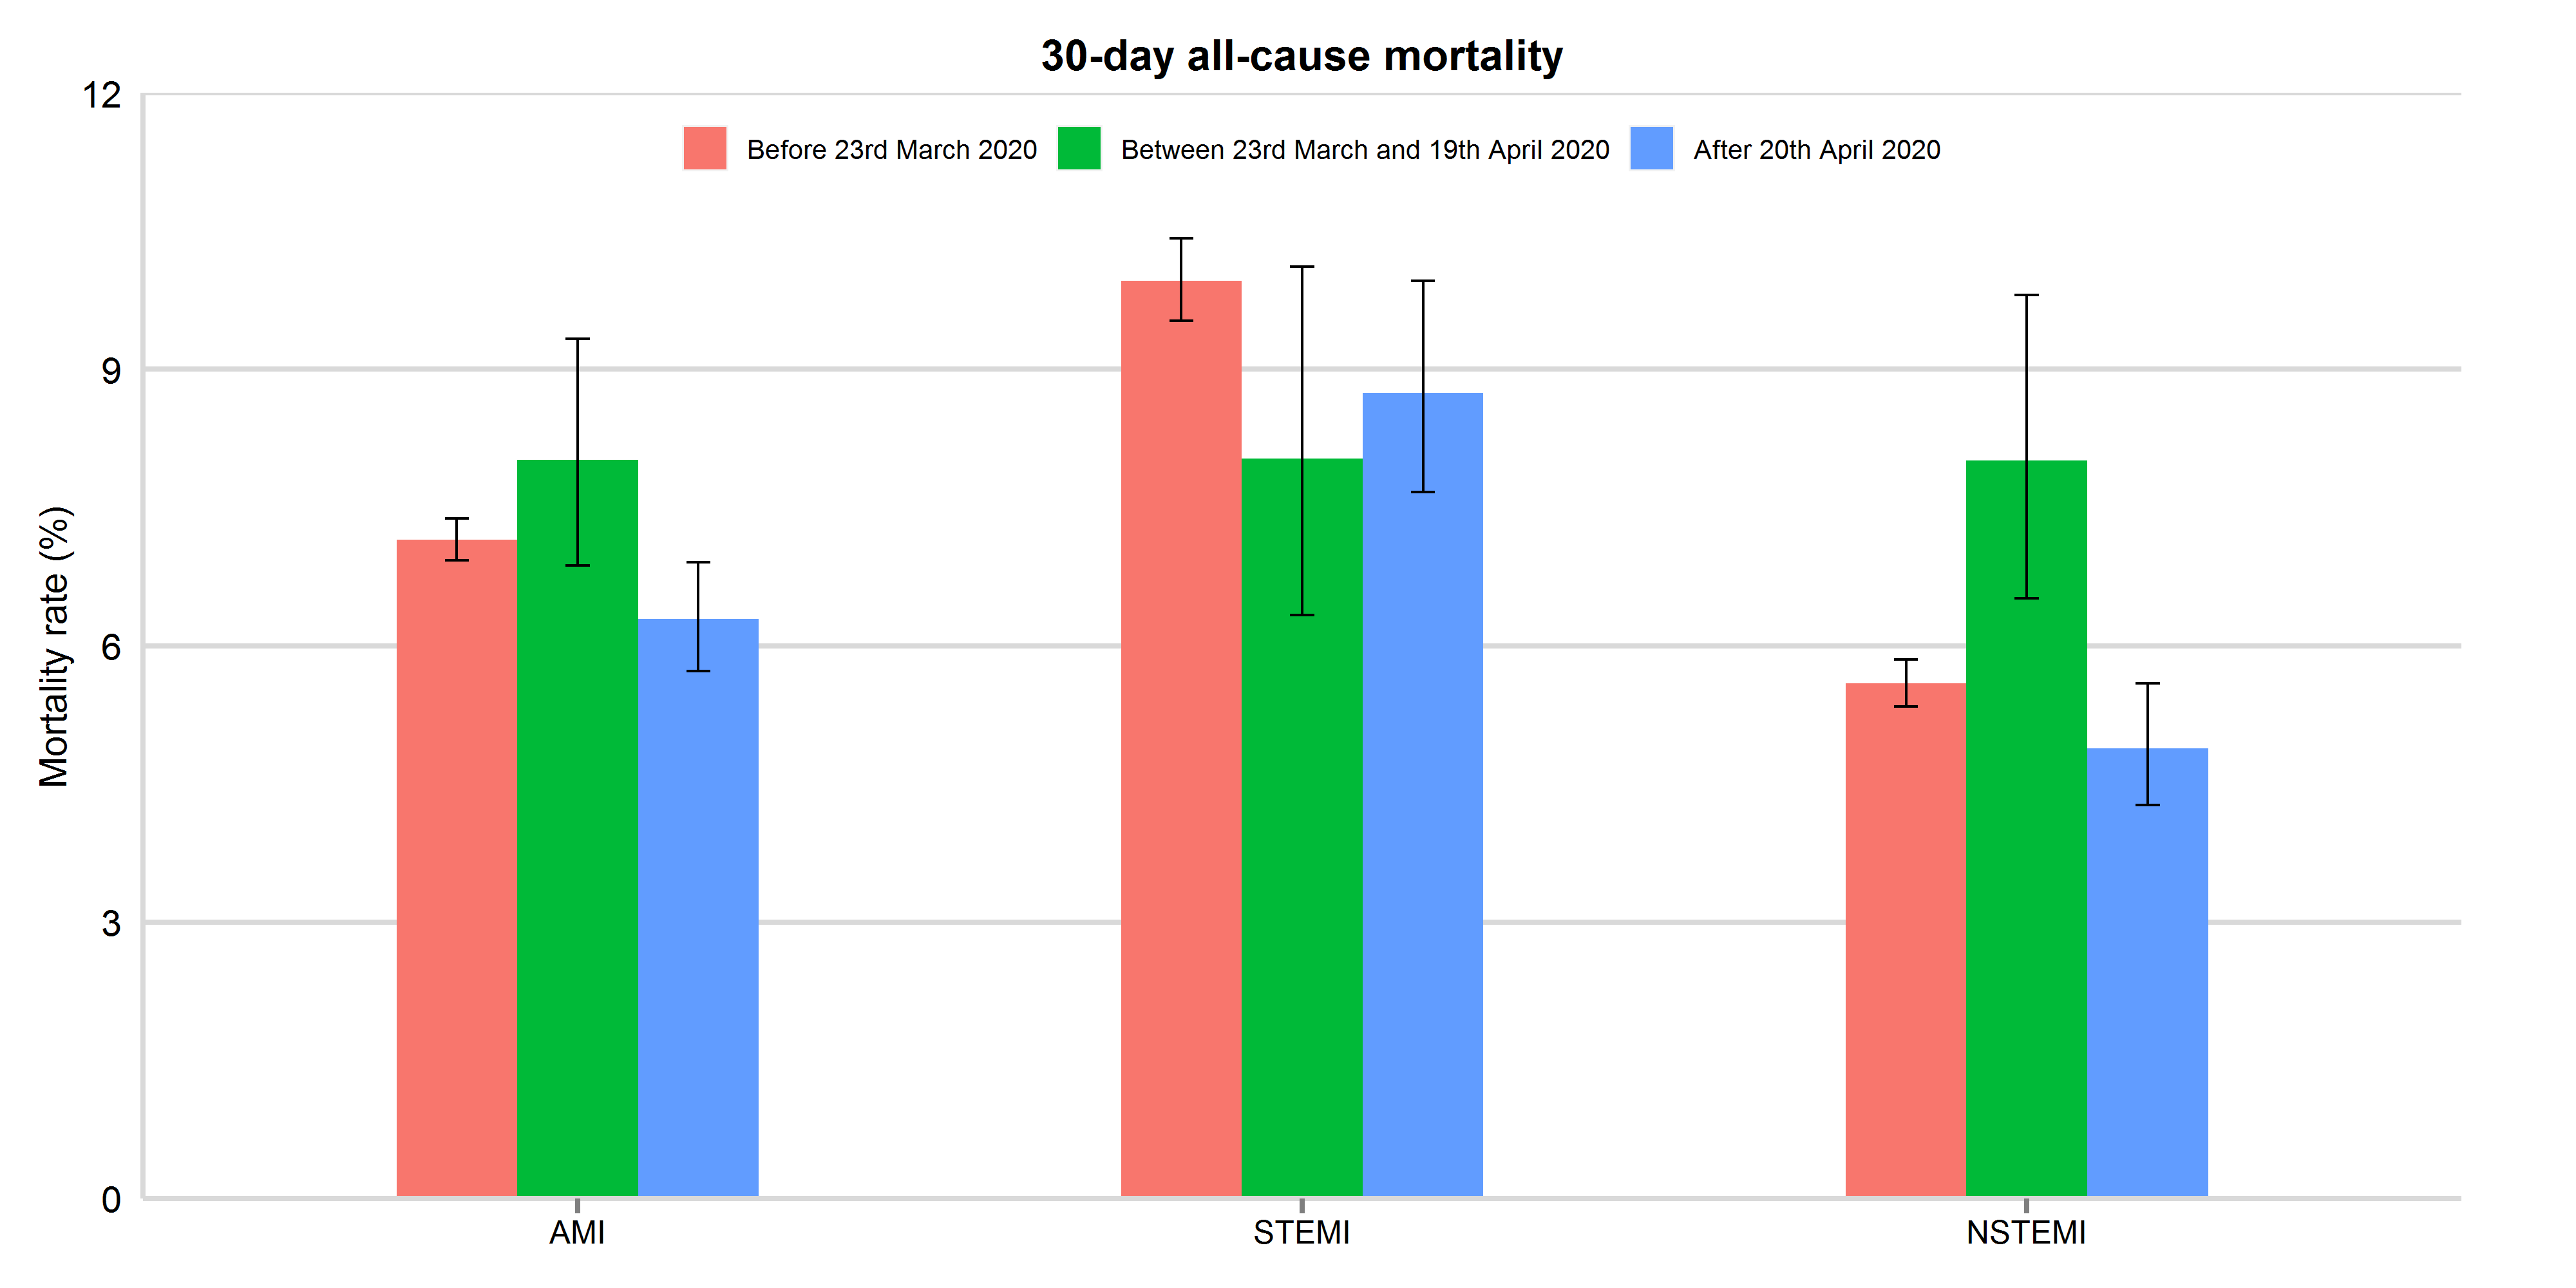
Mortality rates were presented with 95% confidence interval. AMI: acute myocardial infarction; STEMI: ST-elevation myocardial infarction; NSTEMI: non-ST elevation myocardial infarction
Figure 4: 30-day all-cause mortality between 3rd November 2019 and 15th August 2020, by study period and AMI type
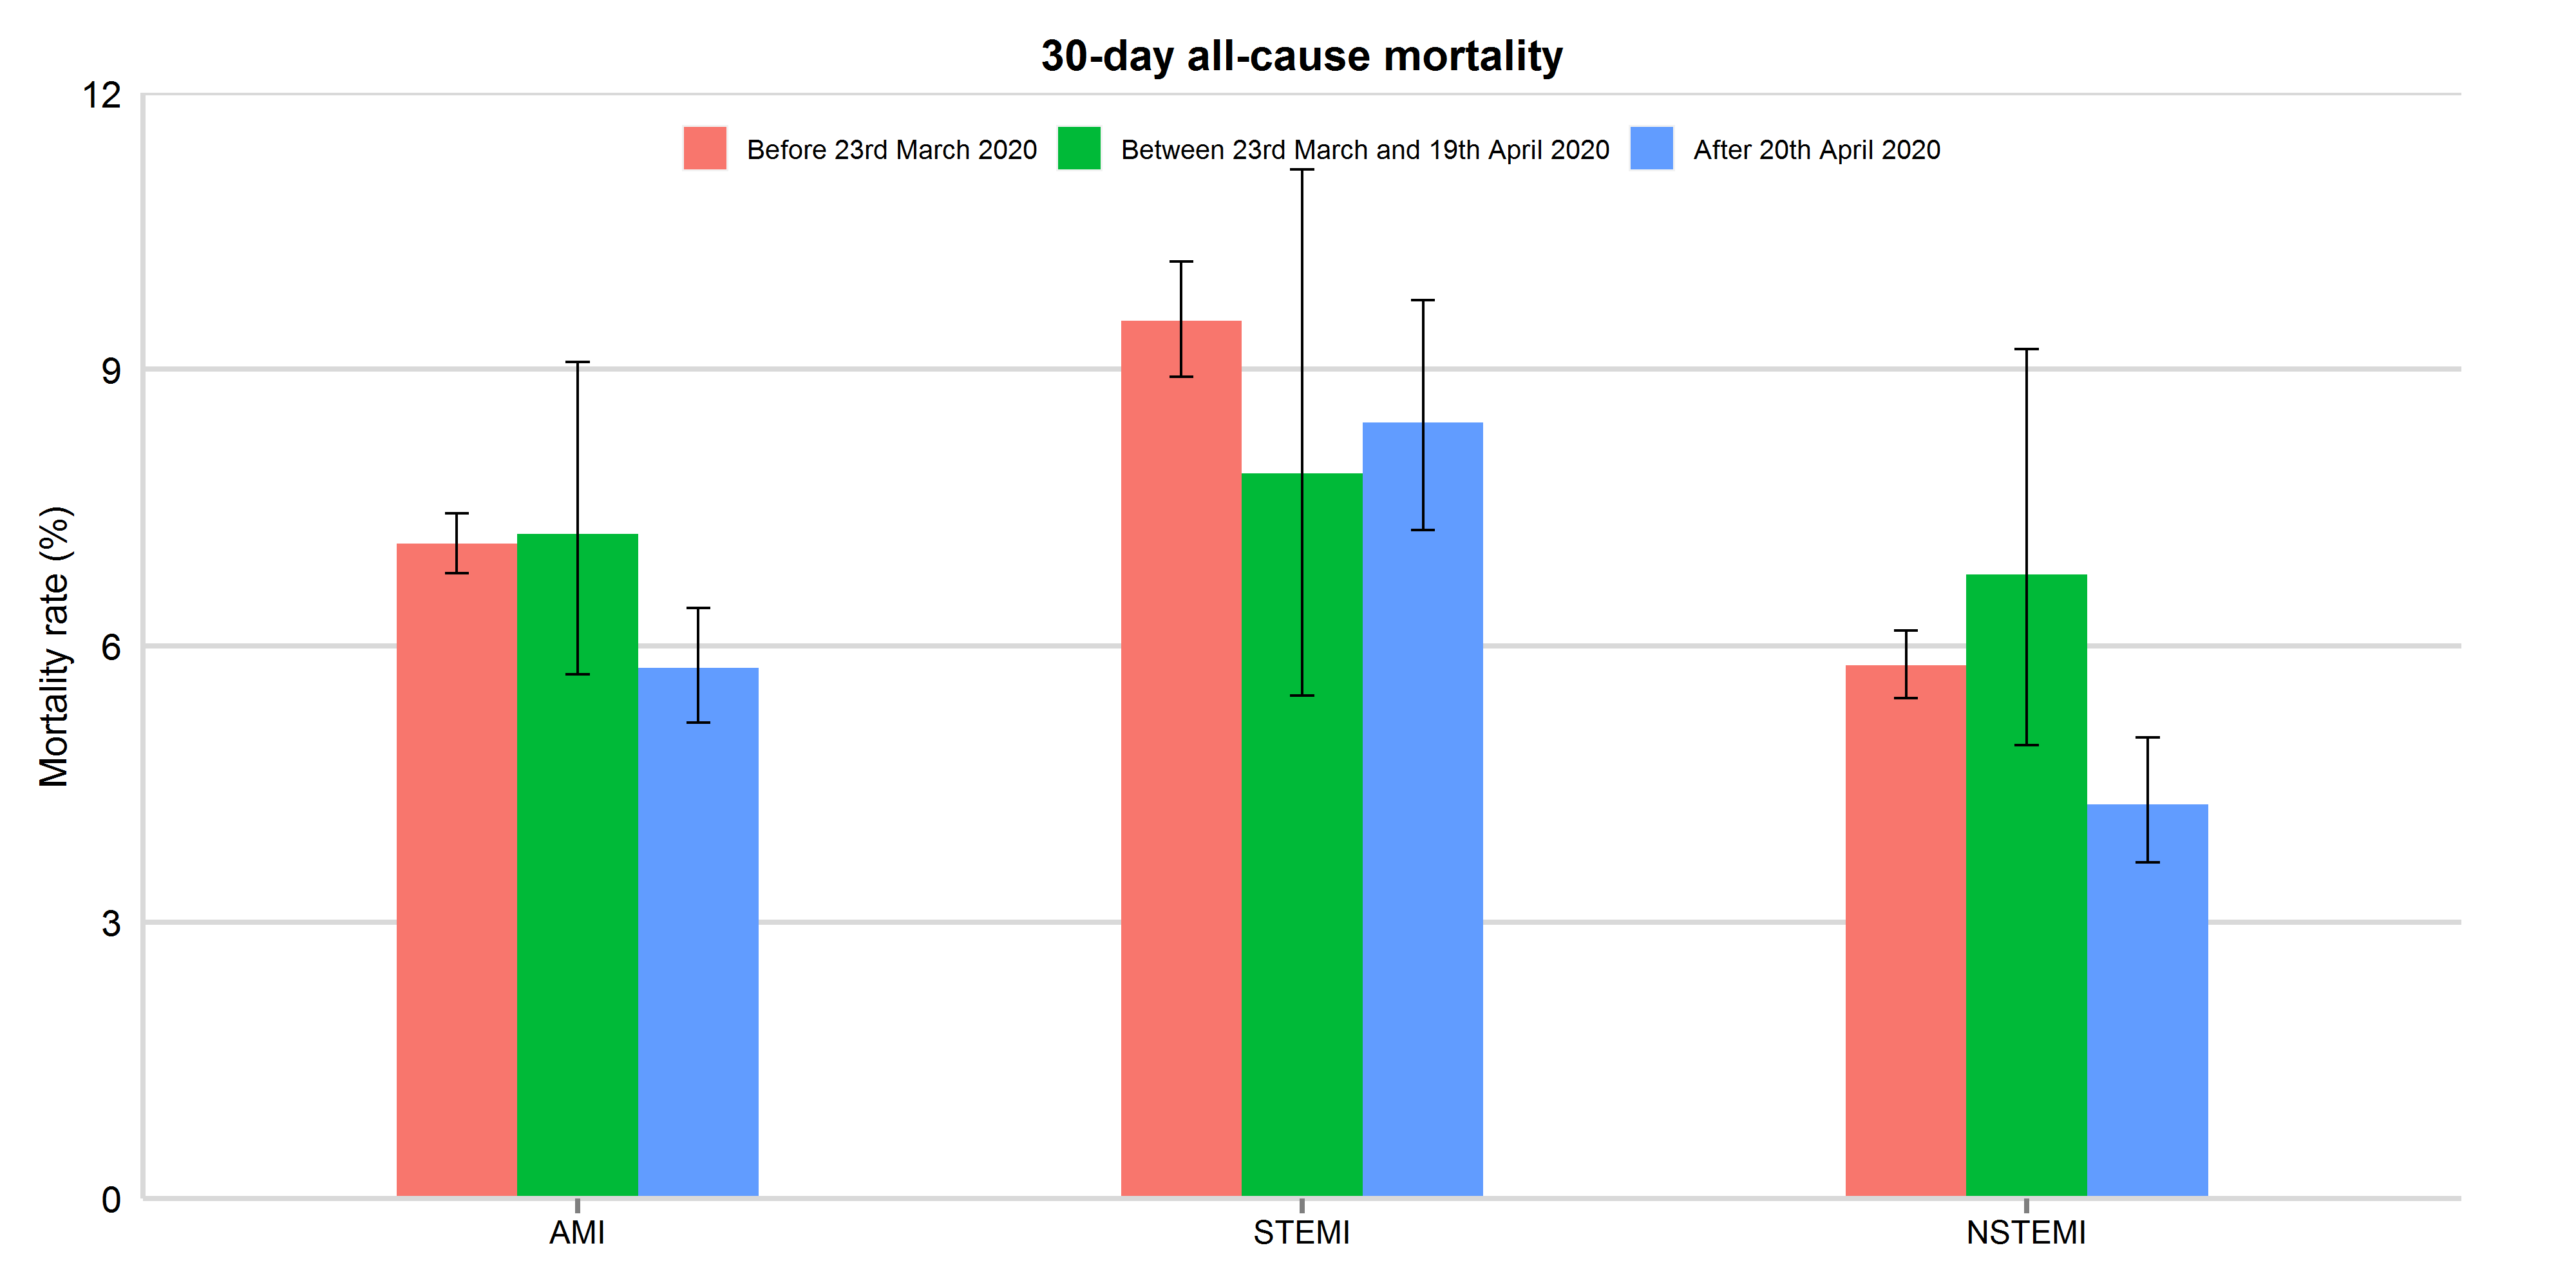
Mortality rates were presented with 95% confidence interval. AMI: acute myocardial infarction; STEMI: ST-elevation myocardial infarction; NSTEMI: non-ST elevation myocardial infarction
Figure 4: 30-day all-cause mortality between 3rd November 2019 and 30th September 2020, by study period and AMI type (updated 11th November 2020)
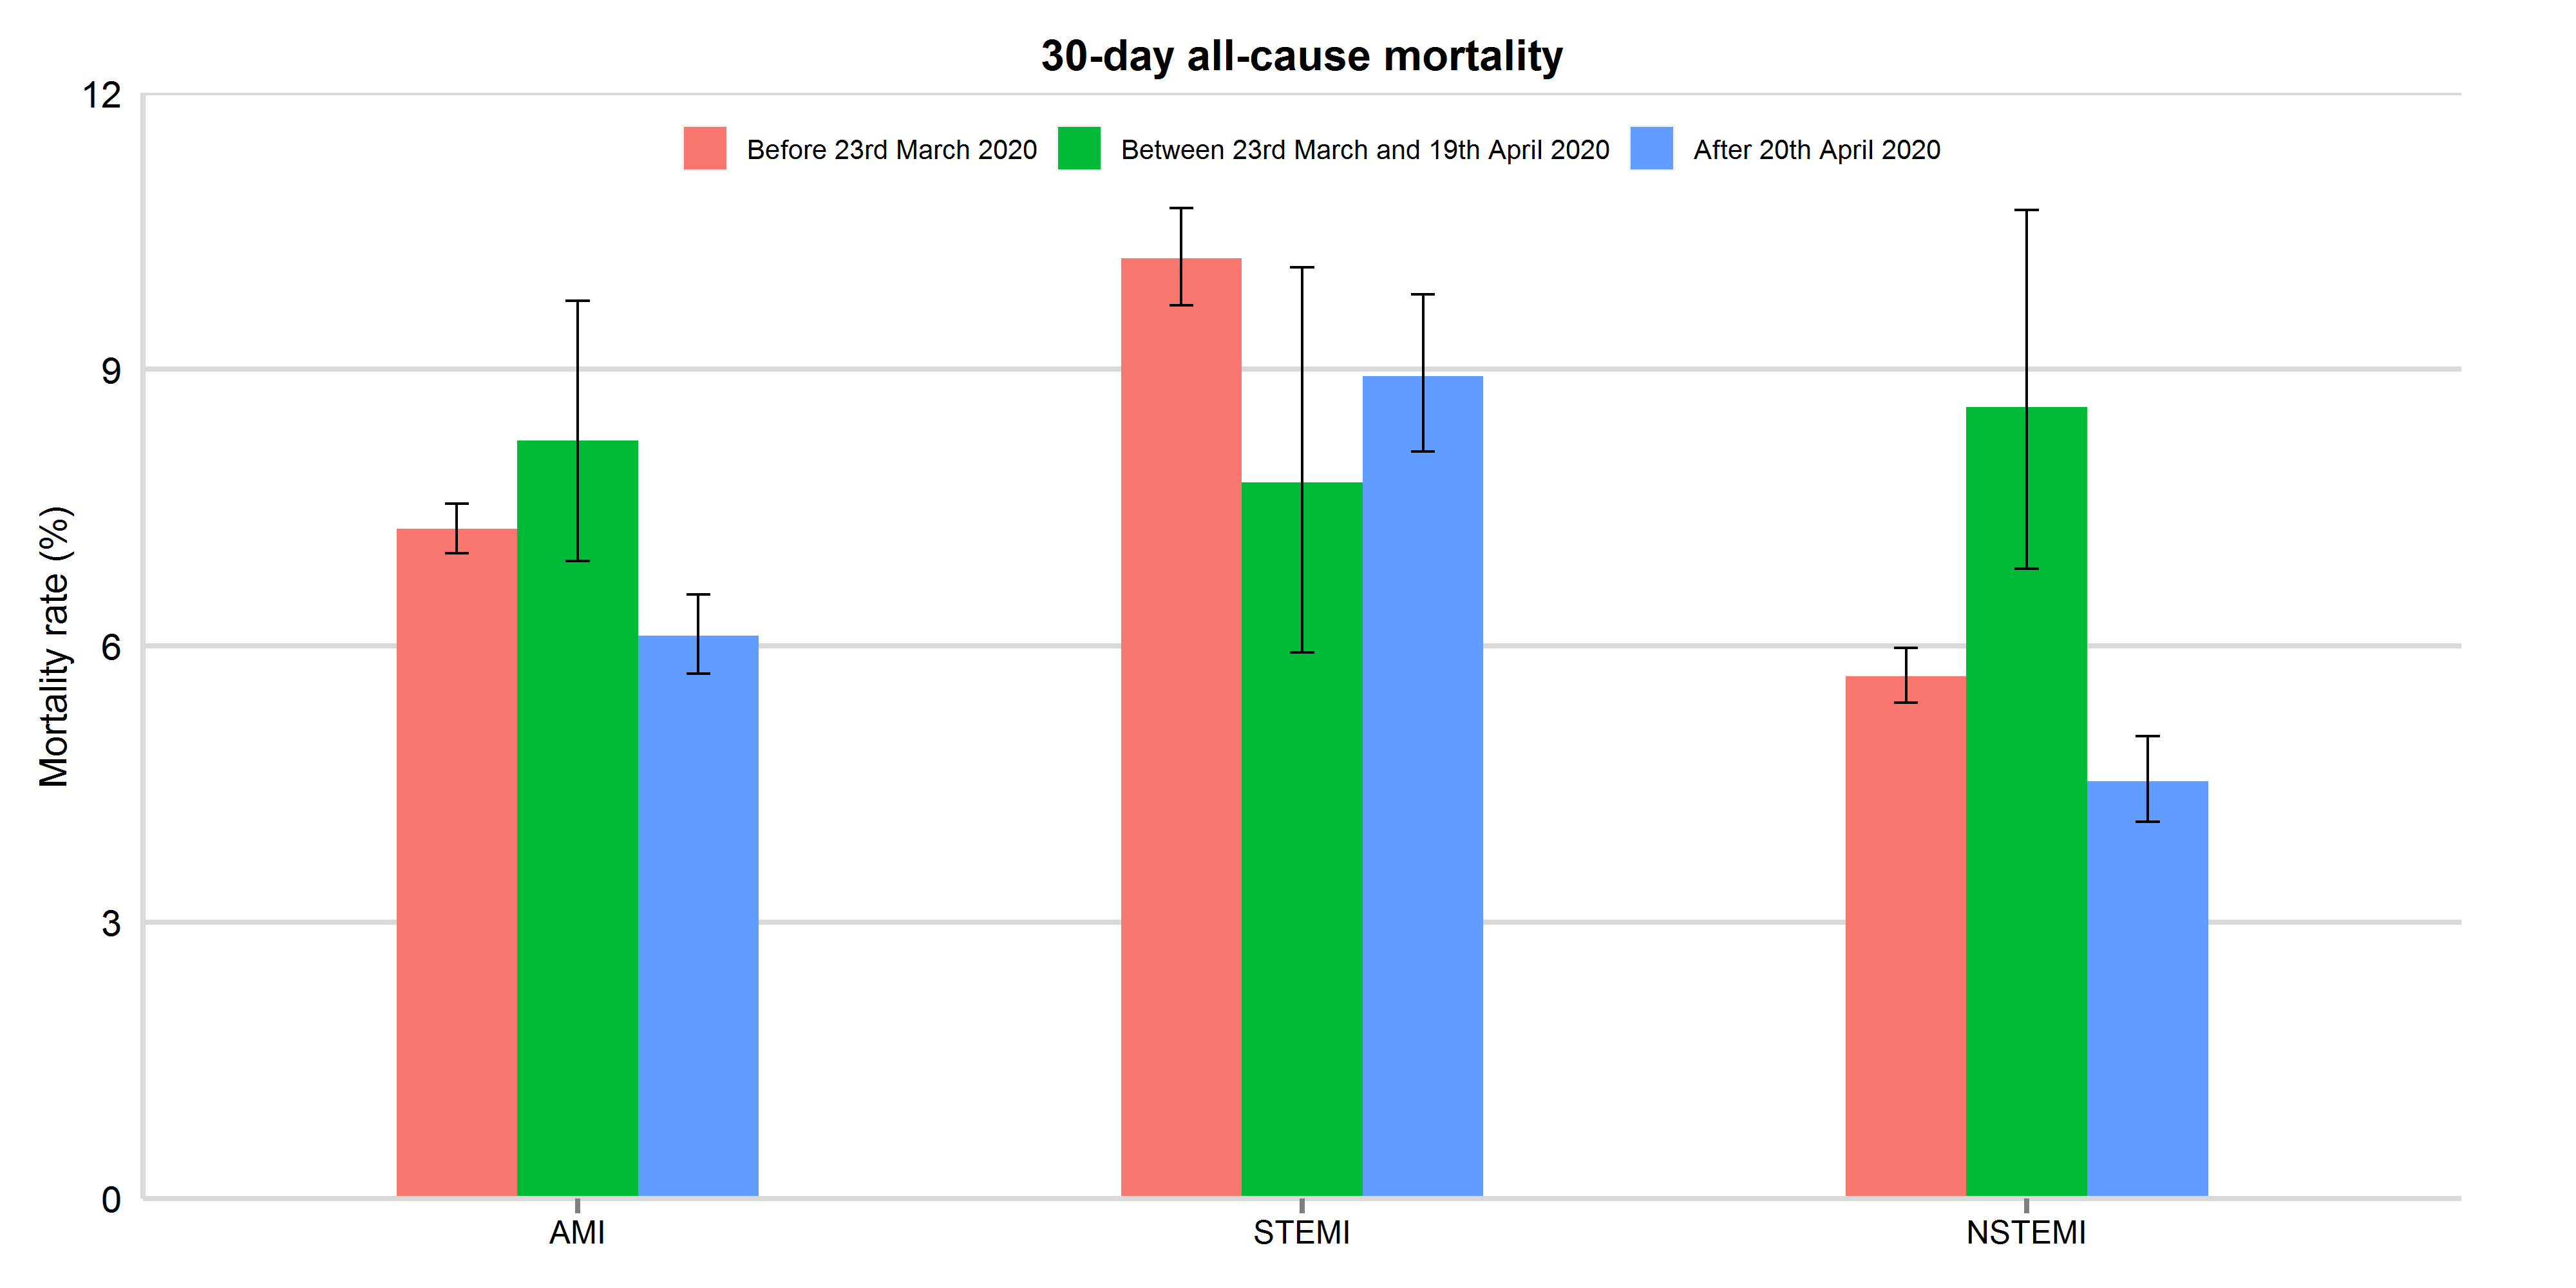
Mortality rates were presented with 95% confidence interval. AMI: acute myocardial infarction; STEMI: ST-elevation myocardial infarction; NSTEMI: non-ST elevation myocardial infarction
Figure 4: 30-day all-cause mortality between 3rd November 2019 and 8th December 2020, by study period and AMI type (updated 11th Feb 2021)
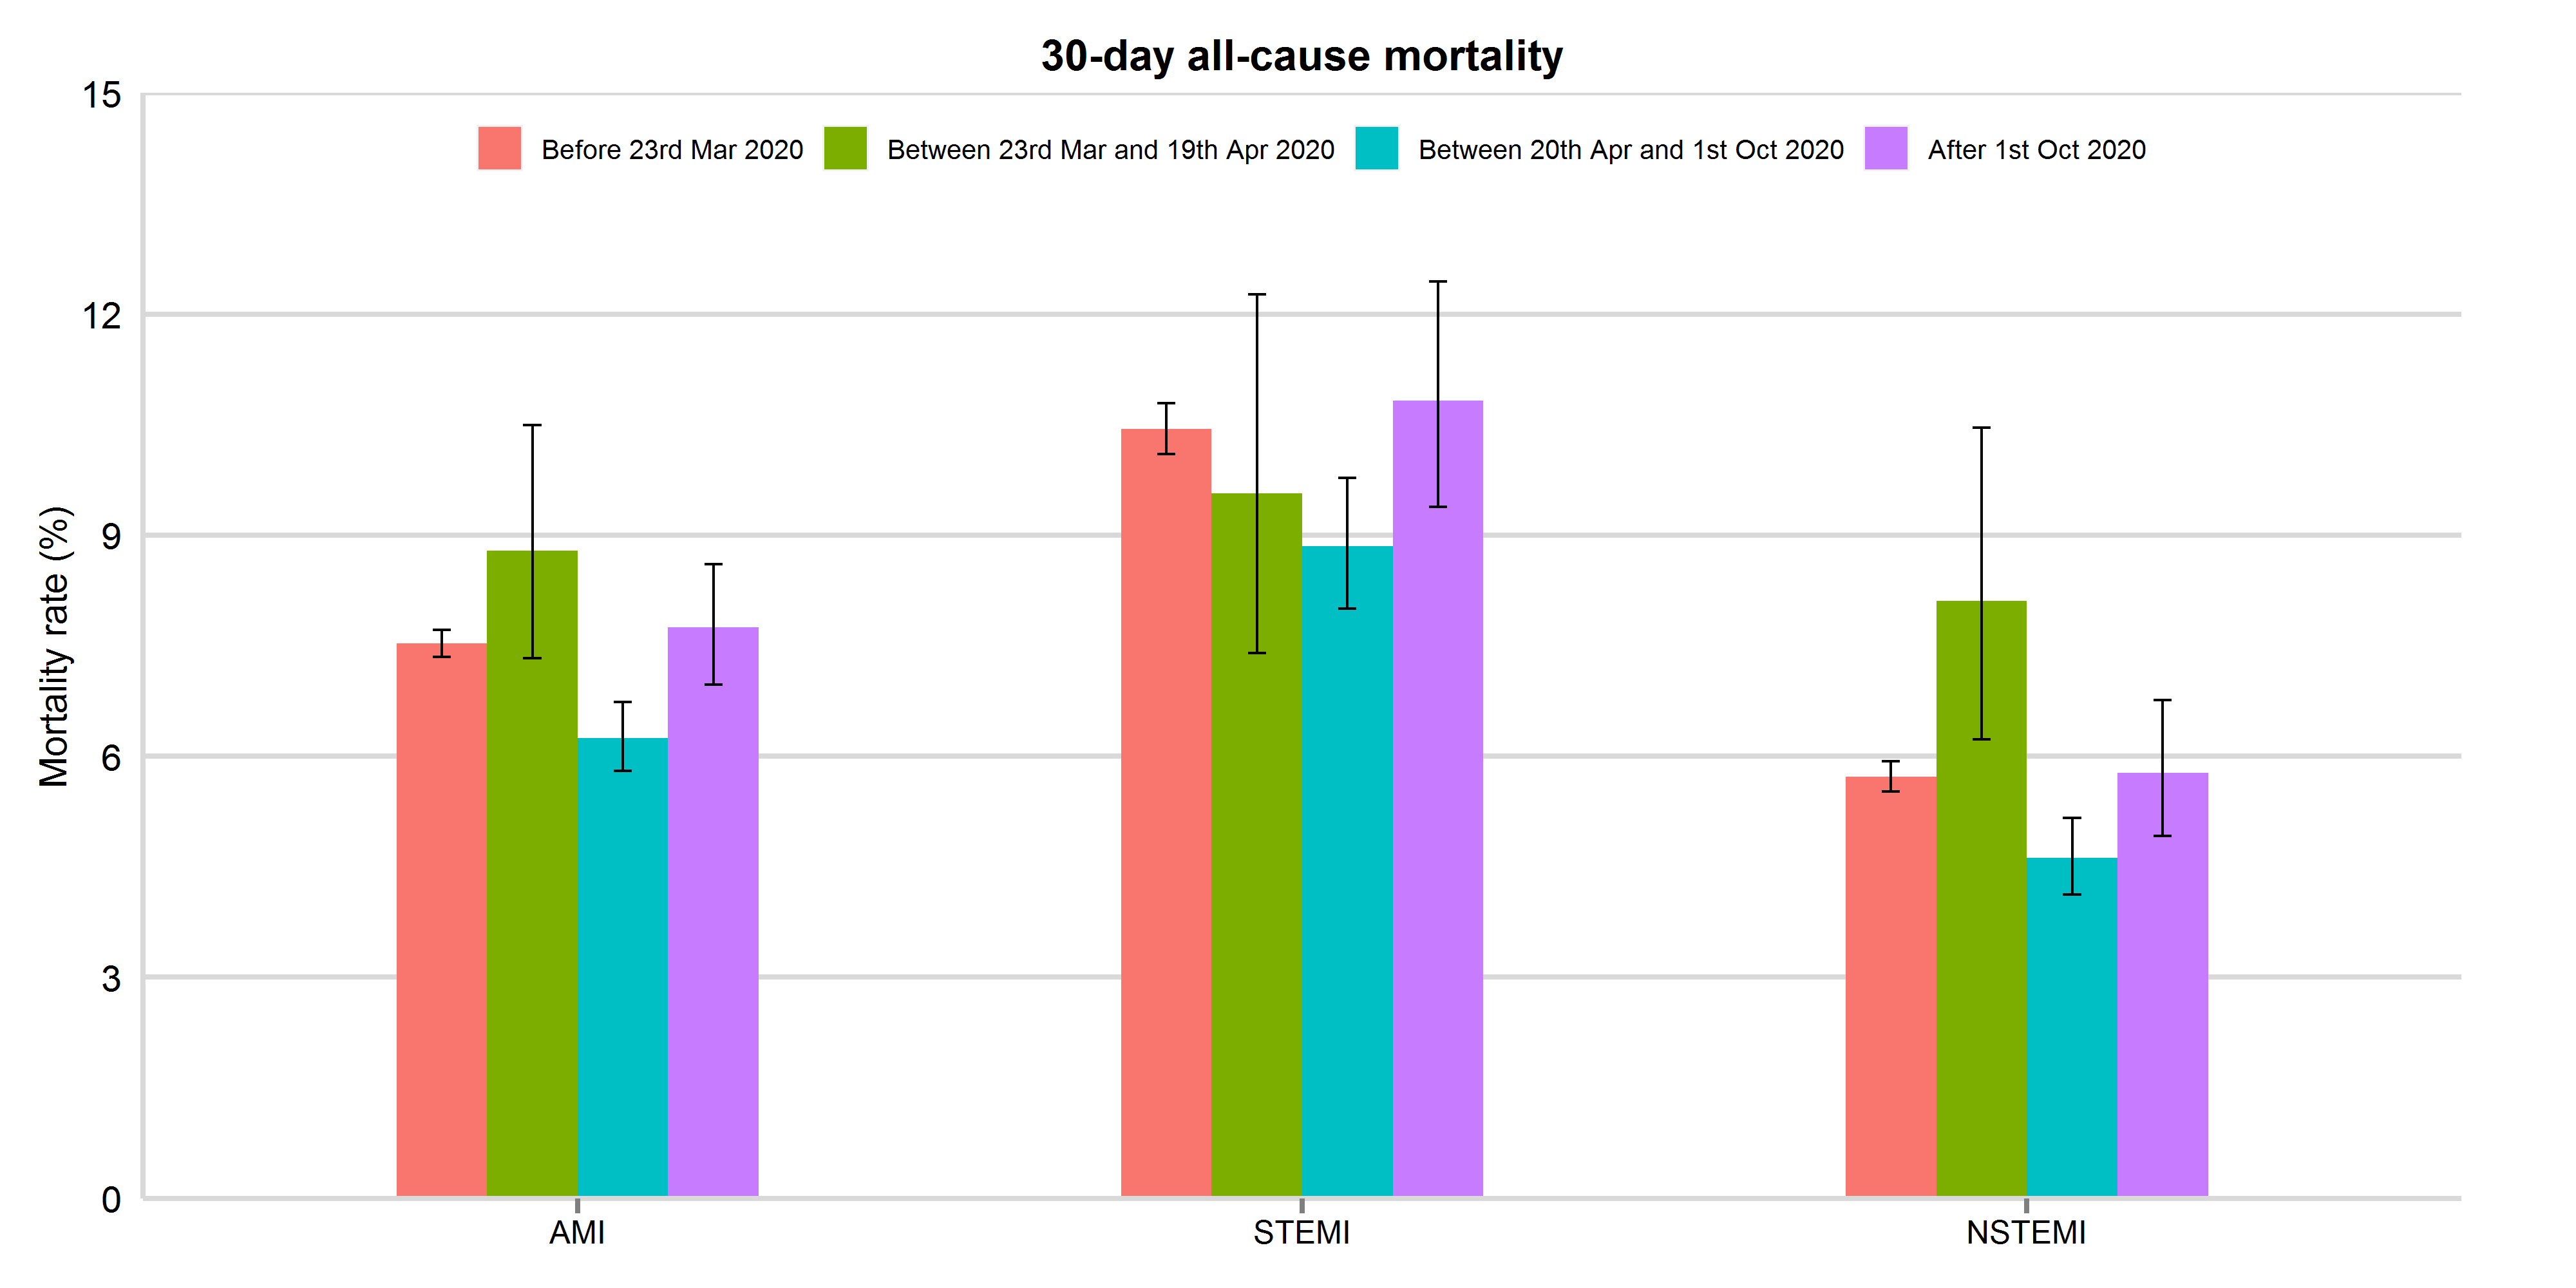
Mortality rates were presented with 95% confidence interval. AMI: acute myocardial infarction; STEMI: ST-elevation myocardial infarction; NSTEMI: non-ST elevation myocardial infarction
Patients with NSTEMI
There was a 49.3% decrease to a nadir on 19th April in the number of hospitalisations with NSTEMI representing a decline in the median daily number of admission from 69 to 35 (IRR 0.51, 95% CI 0.47 to 0.54). From the nadir to 30th June 2020, the median number of admission increased to 46 (1.32, 95% CI 1.22 to 1.42) (Figure 1).