Excess acute cardiovascular deaths during COVID-19 pandemic
Cardiovascular disease (CVD) is one of the most prevalent underlying condition associated with increased mortality from COVID-19 infection. Yet, we and others have shown a substantial reduction in presentations to hospitals with acute cardiovascular (CV) conditions including acute coronary syndrome, heart failure, cardiac arrhythmia and stroke during the pandemic. This would be expected to result in a much higher number of deaths, unless there has been an actual decrease in the incidence of these acute conditions. We now report, with high temporal resolution, CV specific mortality during COVID-19 in England and Wales. In particular, we have evaluated the location of CV deaths (e.g. hospitals, home or care homes), their relation to COVID-19 infection and the specific CV fatal events that contributed directly to death.
The study has been published as "Place and causes of acute cardiovascular mortality during the COVID-19 pandemic" in the Heart medical journal or could be accessed through the White Rose Research Online repository.
Summary results (updated 7th Sep 2020)
Between 1st January 2014 and 30th June 2020, there were 3,450,381 deaths from all-causes among adults. The proportion of deaths increased with increasing age band and there were 1,752,908 (50.8%) in women. People dying from any of the directly contributing CV categories accounted for 587,225 (17.0%) of all deaths, of which 6.0% had at least two of the pre-defined CV categories that directly contributed to death. Most deaths occurred in hospital (63.0%) followed by home (23.5%) and at care home (13.5%).
Acute CV deaths after 2nd March 2020
Following the first UK death from COVID-19 on 2nd March 2020, there were 28,969 acute CV deaths of which 5.1% related to COVID-19 (7.9% suspected; 92.1% confirmed), and an excess acute CV mortality of 2,085 (a proportional increase of 8%) compared with the expected historical average in the same time period of the year. COVID-19 deaths accounted for 1,307 (71.0%) of all excess deaths after this date (Figure 1).
Figure 1. Time series of acute CV deaths, by place of death
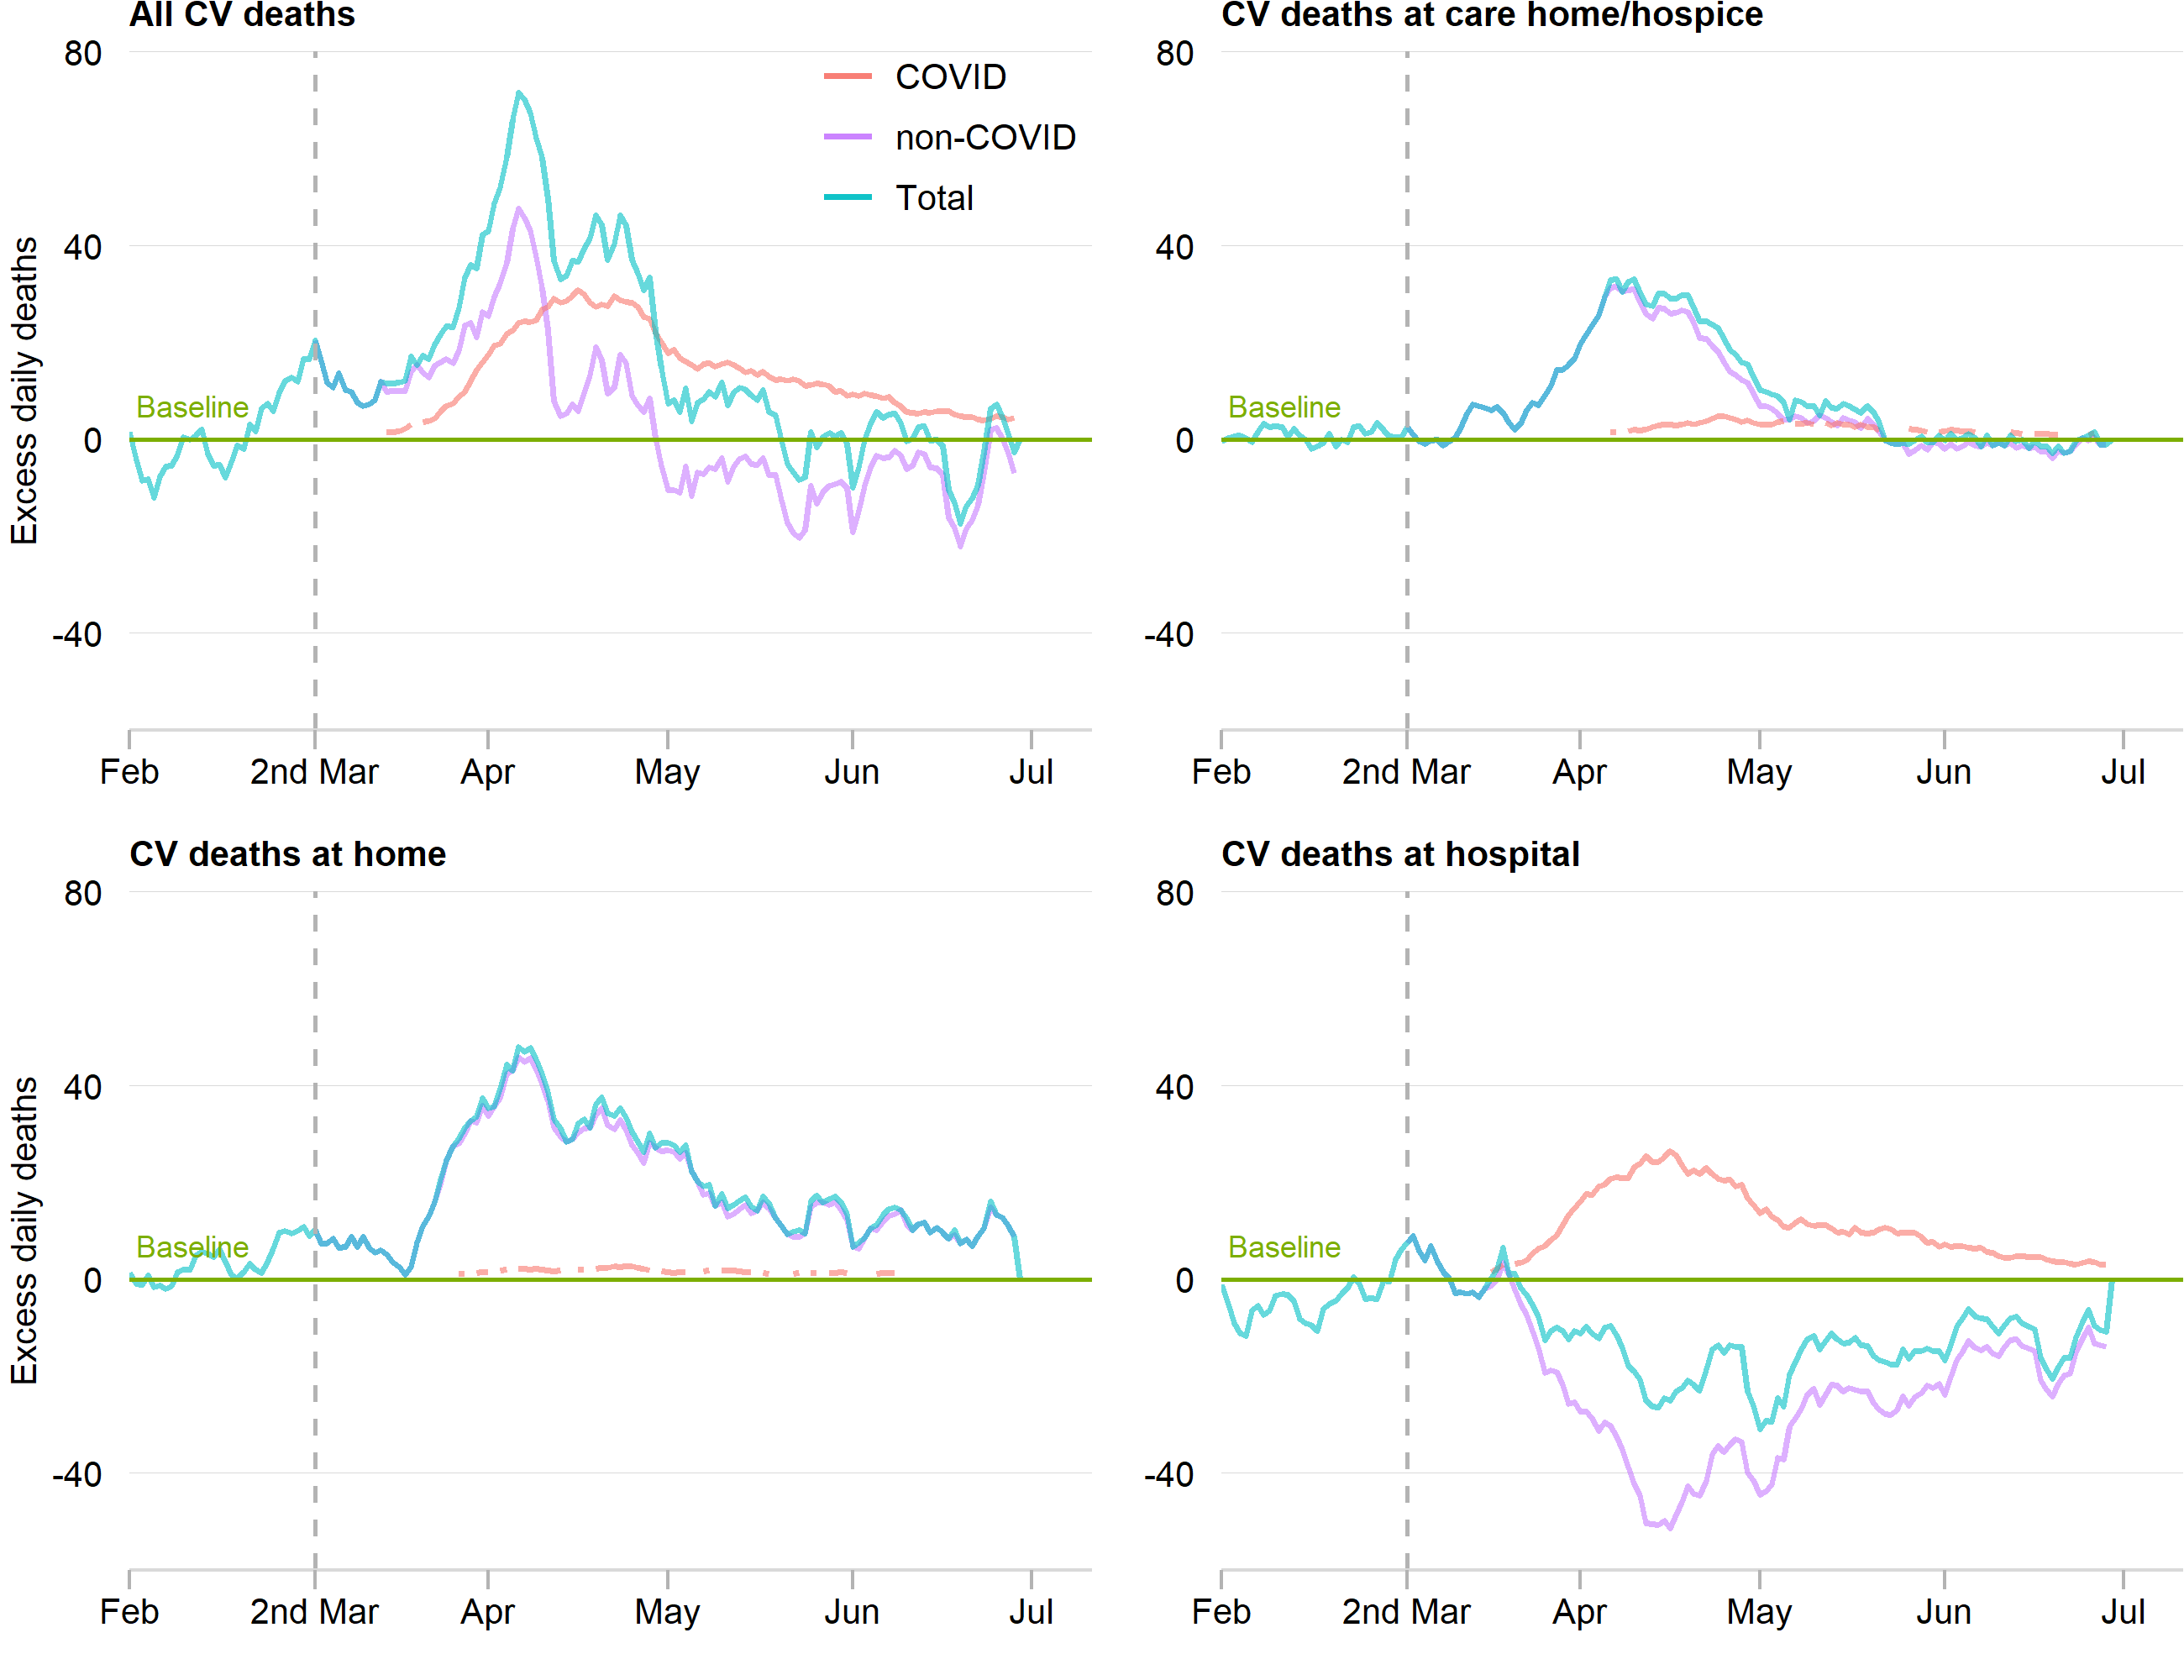
The number of daily CV deaths is presented using a 7-day simple moving average (indicating the mean number of daily CV deaths for that day and the preceding 6 days) from 1st February 2020 up to and including 30th June 2020, adjusted for seasonality. The number of non-COVID-19 excess CV deaths each day from 1st February 2020 were subtracted from the expected daily death estimated using Farrington surveillance algorithm in the same time period. The green line is a zero historical baseline. The red line represents daily COVID-19 CV death from 2nd March to 30th June 2020, the purple line represents excess daily non-COVID-19 CV death from 2nd March to 30th June 2020 and the blue line represents the total excess daily CV death from 1st February to 30th June 2020.
Figure 1. Time series of acute CV deaths, by place of death (updated 11th November 2020)
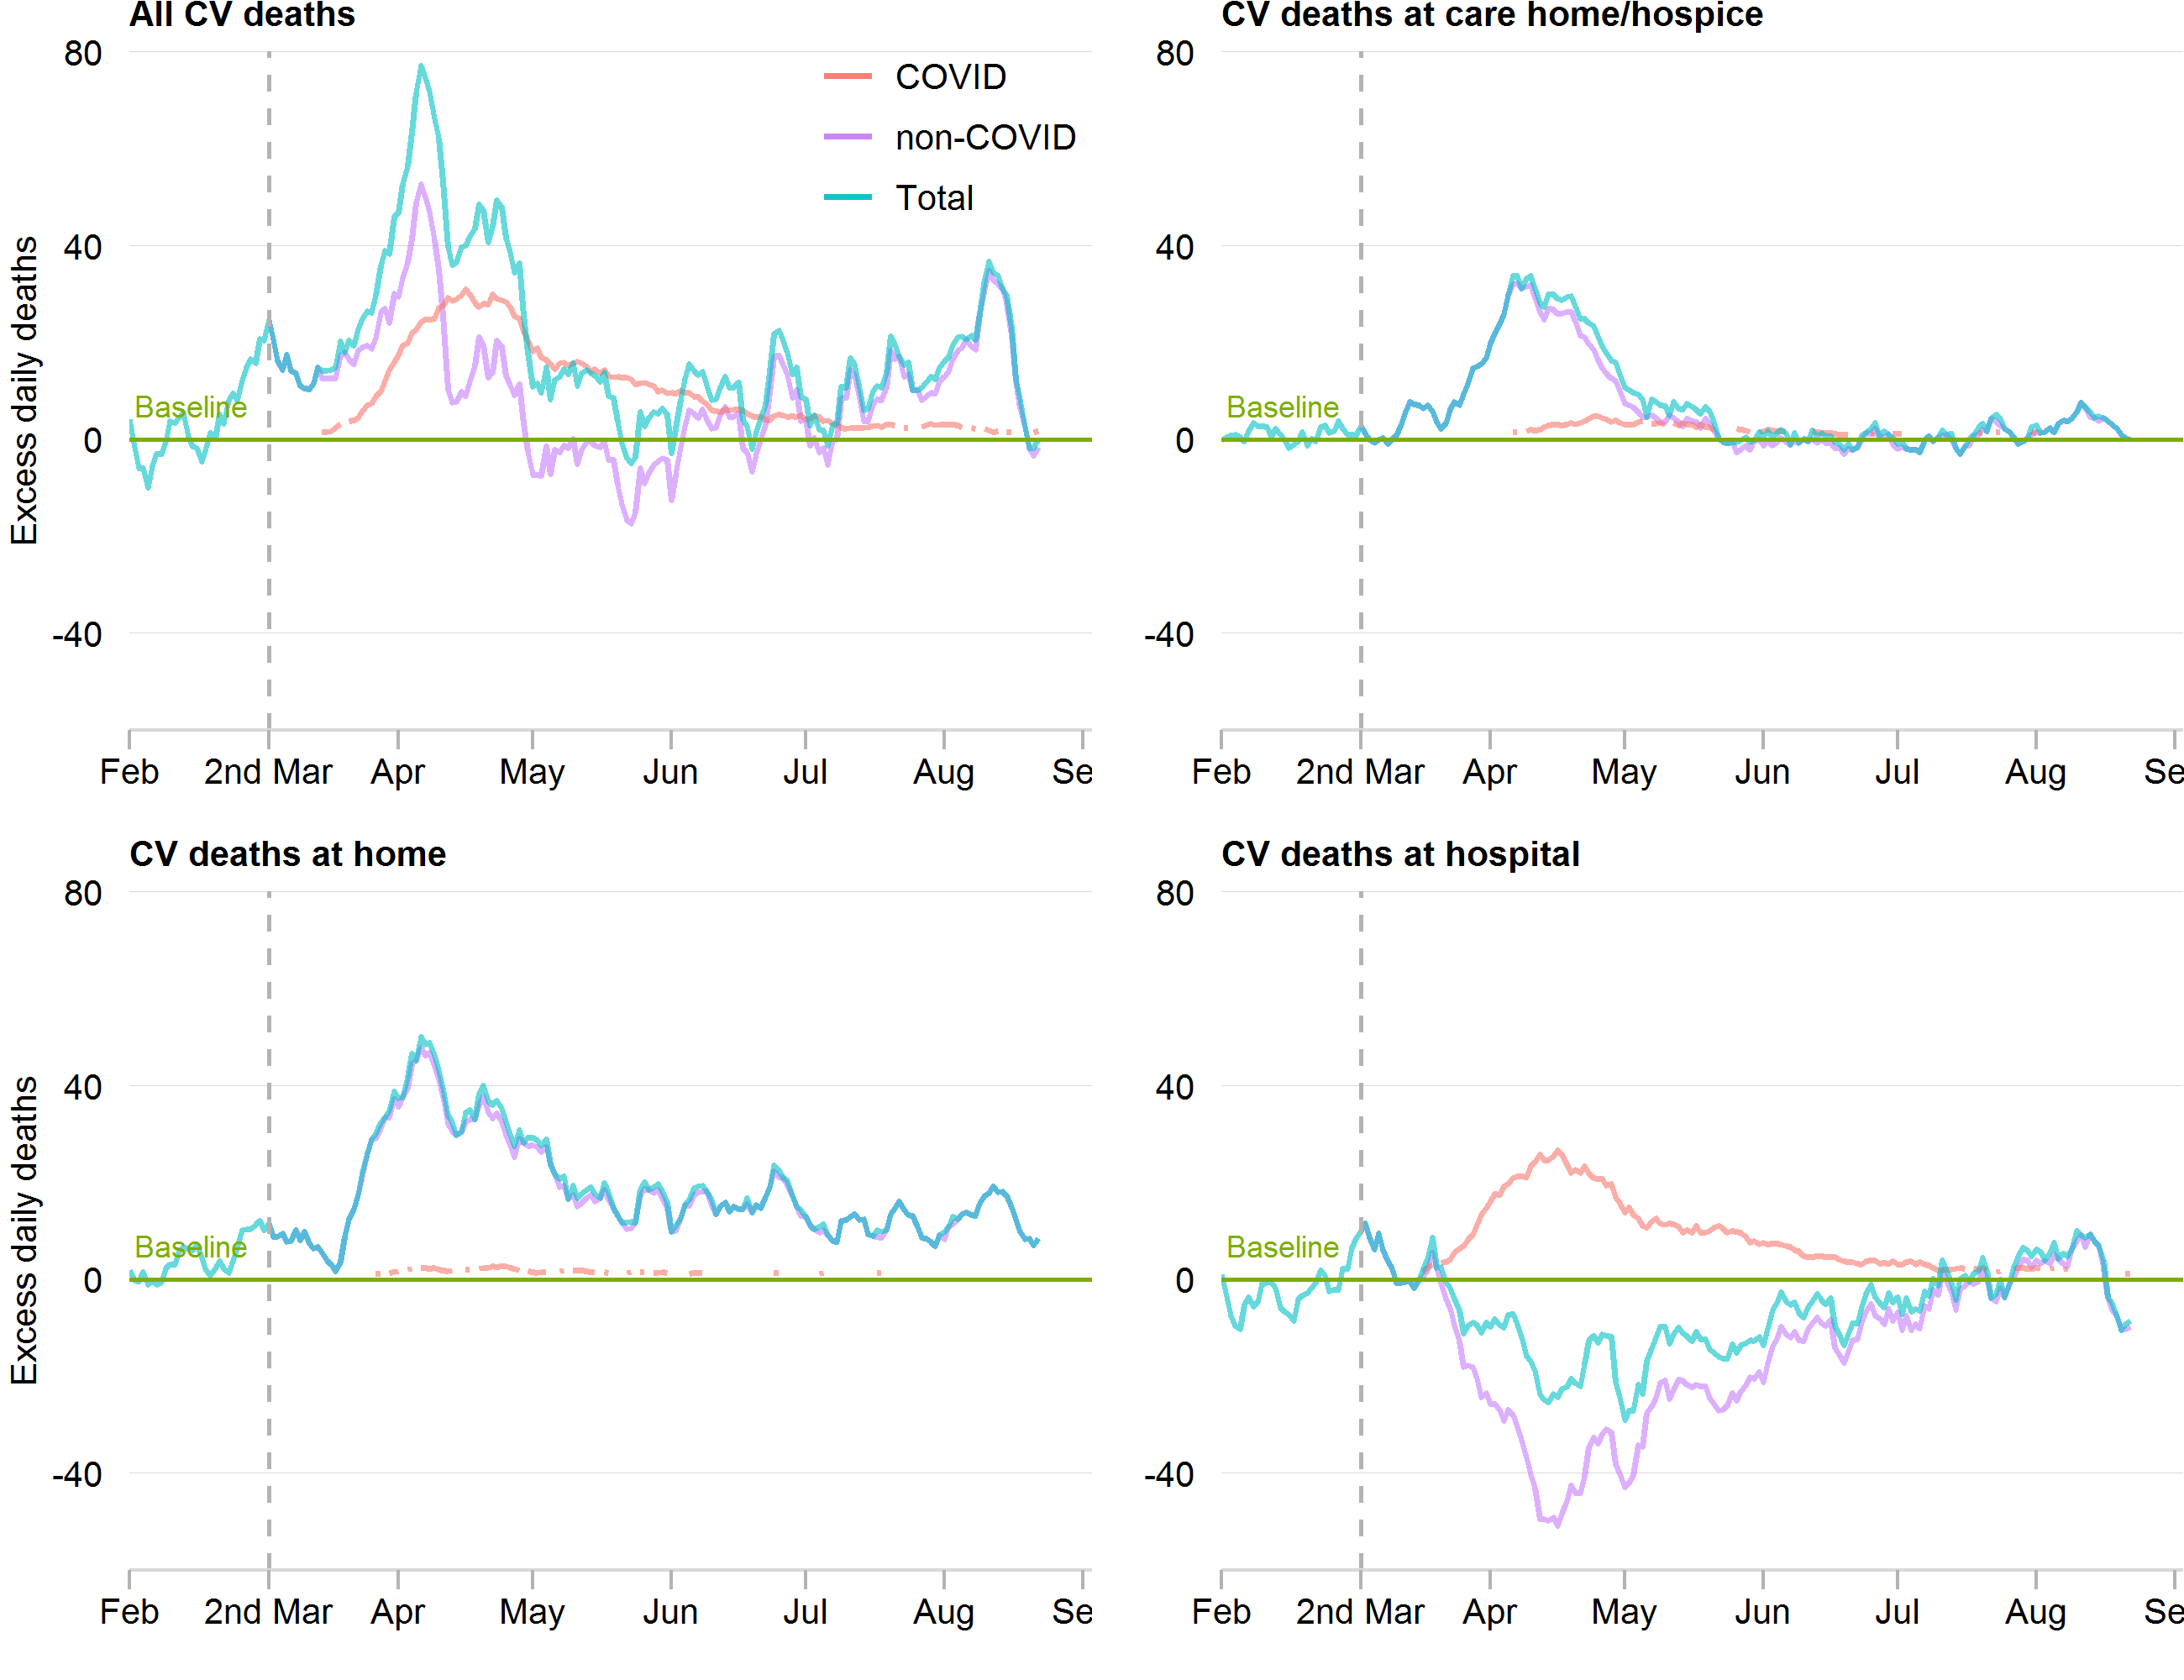
The number of daily CV deaths is presented using a 7-day simple moving average (indicating the mean number of daily CV deaths for that day and the preceding 6 days) from 1st February 2020 up to and including 31th August 2020, adjusted for seasonality. The number of non-COVID-19 excess CV deaths each day from 1st February 2020 were subtracted from the expected daily death estimated using Farrington surveillance algorithm in the same time period. The green line is a zero historical baseline. The red line represents daily COVID-19 CV death from 2nd March to 31th August 2020, the purple line represents excess daily non-COVID-19 CV death from 2nd March to 31th August 2020 and the blue line represents the total excess daily CV death from 1st February to 31th August 2020.
Qualitatively, excess acute CV mortality began in late March 2020 and peaked in early April 2020. Whist hospital remained the most frequent place of acute CV death, there were proportionally fewer deaths in hospital (53.4% vs 63.0%) and more at home (30.9% vs 23.5%) and in care homes (15.7% vs 13.5%). Moreover, deaths at home saw the greatest increase in excess acute CV deaths (a proportional increase of 35%), followed by deaths at care homes (a proportional increase of 32%) and there was no excess acute CV deaths in hospital. The number of excess acute CV deaths were higher more among men than women (1182 vs. 948; a proportional increase of 8% vs. 7%), and was highest in the age category 18-49 years (176, a proportional increase of 17%). The most frequent cause of acute CV death during the COVID19 pandemic was stroke (35.6%), followed by acute coronary syndrome (24.5%), heart failure (23.4%), pulmonary embolism (9.3%) and cardiac arrest (4.6%) (Table 1). Moreover, deep vein thrombosis demonstrated the greatest increase in excess acute CV death (20, a proportional increase of 23%), followed by pulmonary embolism (437, a proportional increase of 19%) and cardiogenic shock (54, a proportional increase of 14%) (Figure 2).
Figure 2. Time series of acute CV deaths by COVID-19, by cause of death
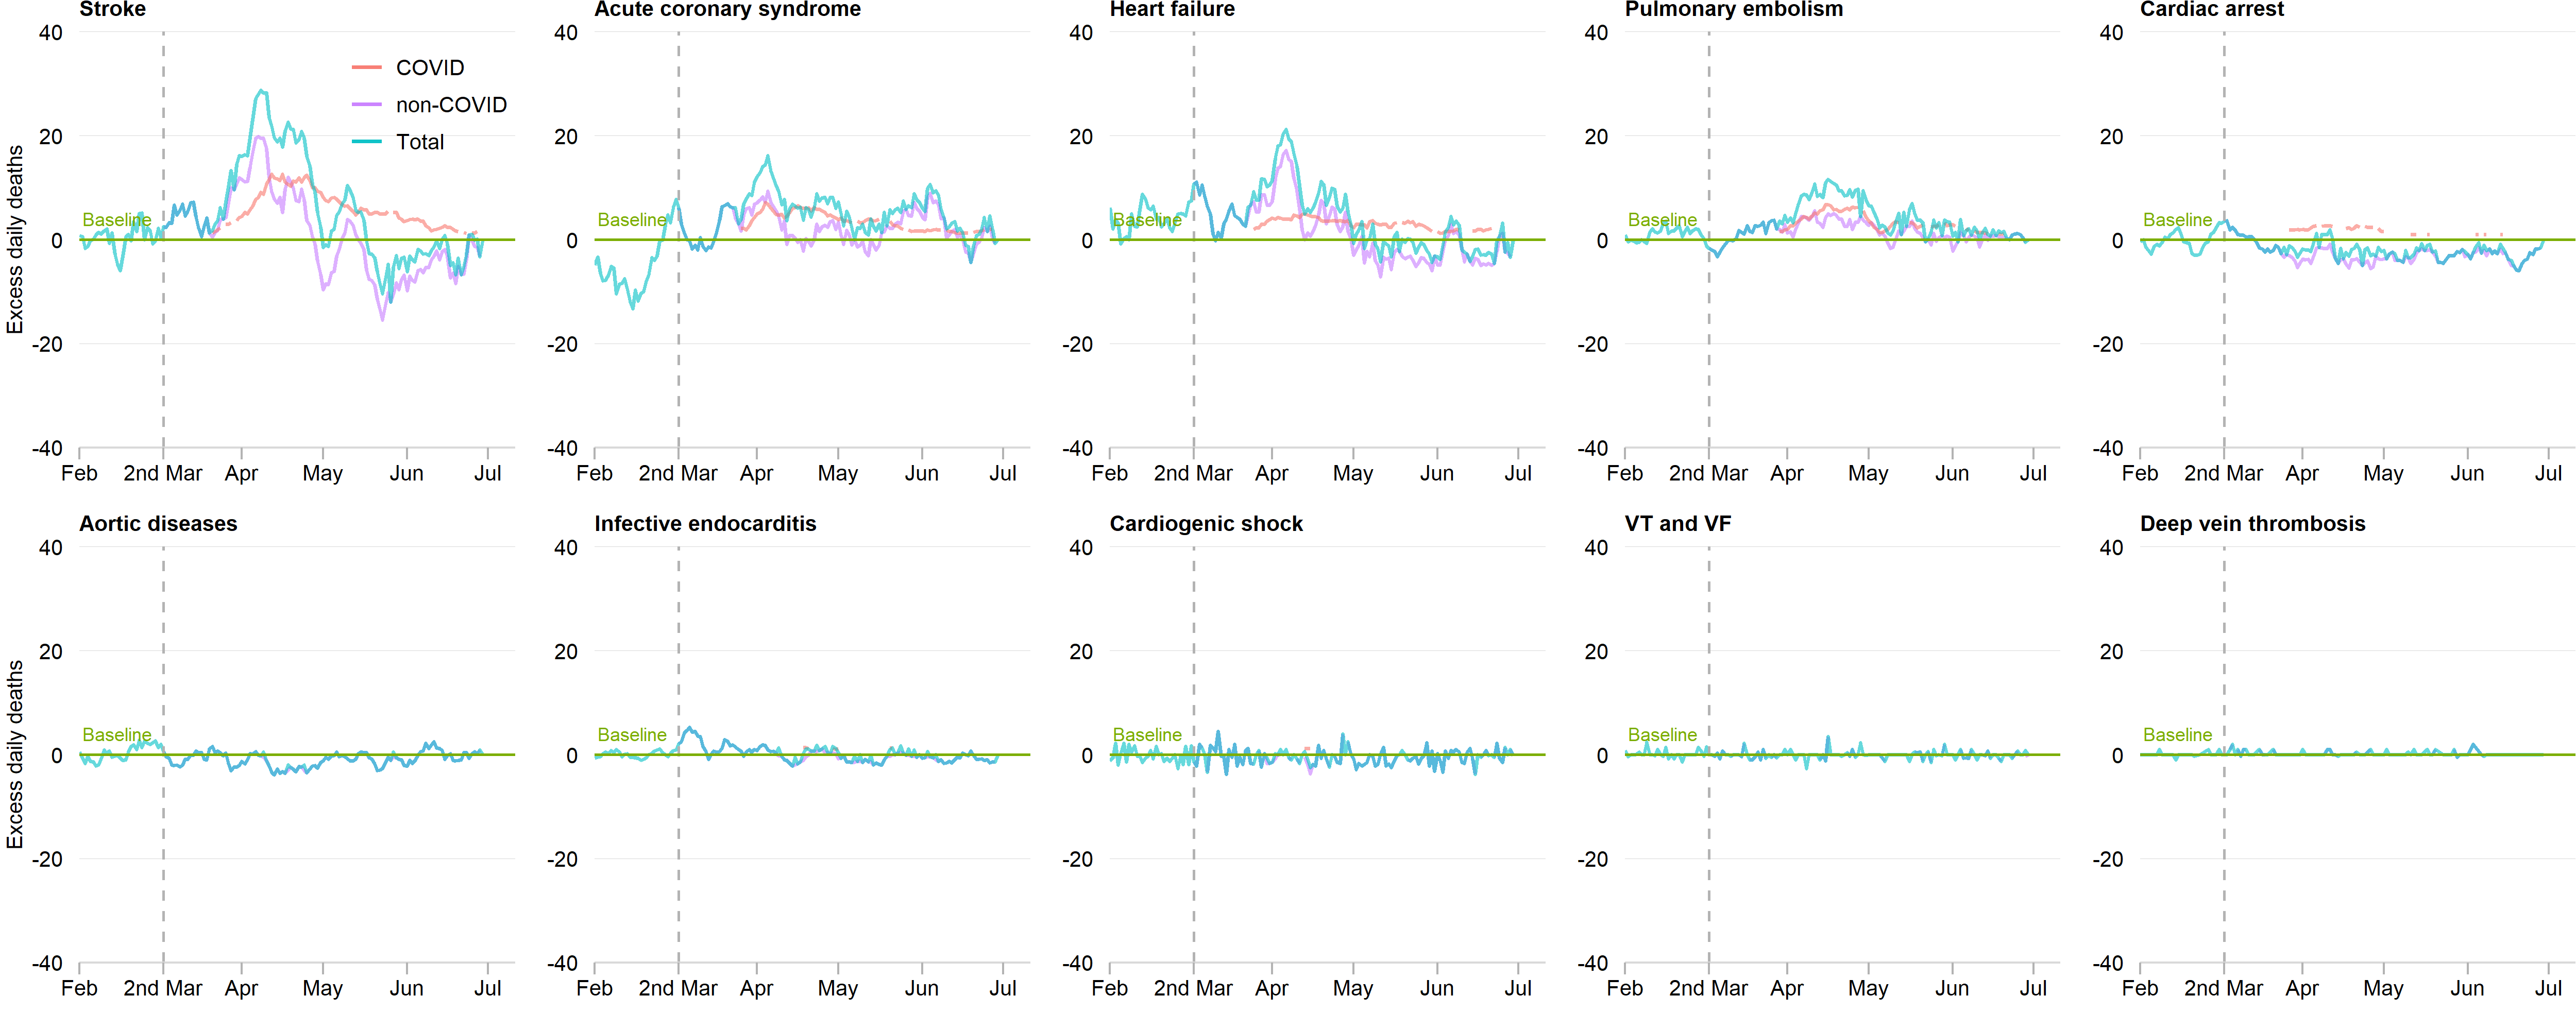
The number of daily CV deaths is presented using a 7-day simple moving average (indicating the mean number of daily CV deaths for that day and the preceding 6 days) from 1st February 2020 up to and including 30th June 2020, adjusted for seasonality. The number of non-COVID-19 excess CV deaths each day from 1st February 2020 were subtracted from the expected daily death estimated using Farrington surveillance algorithm in the same time period. The green line is a zero historical baseline. The red line represents daily COVID-19 CV death from 2nd March to 30th June 2020, the purple line represents excess daily non-COVID-19 CV death from 2nd March to 30th June 2020 and the blue line represents the total excess daily CV death from 1st February to 30th June 2020.
Figure 2. Time series of acute CV deaths by COVID-19, by cause of death (updated 11th November 2020)
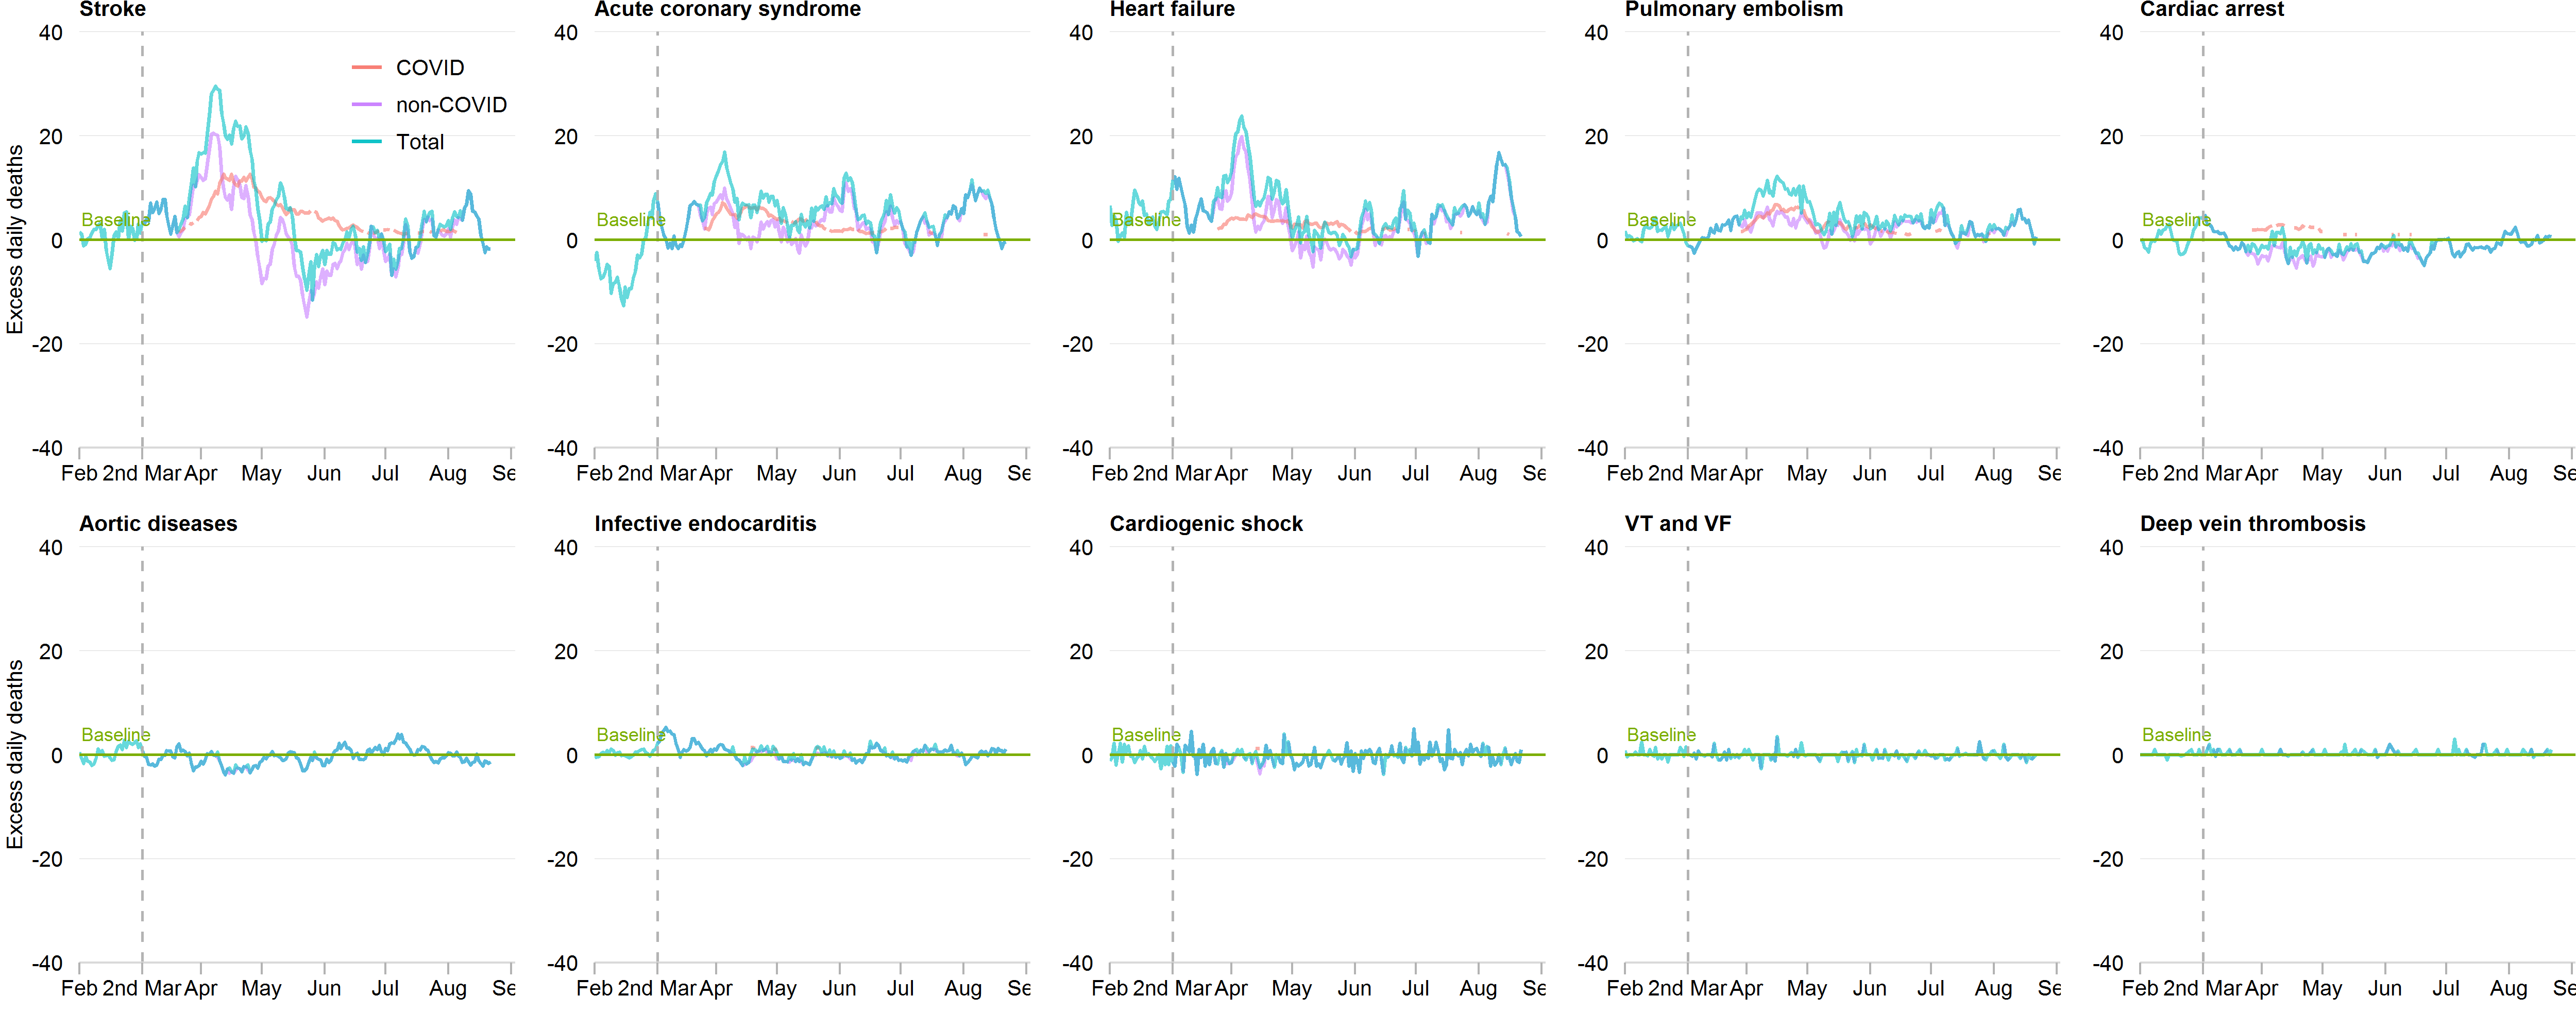
The number of daily CV deaths is presented using a 7-day simple moving average (indicating the mean number of daily CV deaths for that day and the preceding 6 days) from 1st February 2020 up to and including 31th August 2020, adjusted for seasonality. The number of non-COVID-19 excess CV deaths each day from 1st February 2020 were subtracted from the expected daily death estimated using Farrington surveillance algorithm in the same time period. The green line is a zero historical baseline. The red line represents daily COVID-19 CV death from 2nd March to 31th August 2020, the purple line represents excess daily non-COVID-19 CV death from 2nd March to 31th August 2020 and the blue line represents the total excess daily CV death from 1st February to 31th August 2020.
COVID-19 related acute CV deaths
Compared with deaths prior to 2nd March 2020, COVID-19 related acute CV deaths were more likely to occur in hospital (81.1% vs. 63.0%), much less at home (7.1% vs. 23.5%) and remained of similar proportions to non-COVID-19 related acute CV deaths in care homes (13.5% vs. 11.8%). The rate of COVID-19 related excess CV deaths was higher in hospitals than care homes (a proportional increase of 7% vs. +5%), and less at home (a proportional increase of 2%). Excess COVID-19 related acute CV deaths occurred in similar proportions for men and women (a proportional increase of 6% vs. 5%), and the rate of excess COVID-19 related acute CV deaths was comparable across the age bands. The greatest proportional increase of excess COVID-19 related acute CV death was due to pulmonary embolism (251, a proportional increase of 11%) followed by stroke (562, a proportional increase of 6%), acute coronary syndrome (318, a proportional increase of 5%), cardiac arrest (93, a proportional increase of 6%) and heart failure (273, a proportional increase of 4%) (Figure 2).
Place and cause of death after 2nd March 2020
The most frequent causes of excess acute CV death in care homes and hospices were stroke (715, a proportional increase of 39%) and heart failure (227, a proportional increase of 25%), which compared with acute coronary syndrome (768, a proportional increase of 41%) and heart failure (734, a proportional increase of 33%) at home, and pulmonary embolism (155, a proportional increase of 13%) and cardiogenic shock (55, a proportional increase of 15%) in hospital (Figure 3). For stroke, acute coronary syndrome, heart failure and cardiac arrest, the numbers of deaths in hospital were lower than the historical baseline (Figure 3).
Figure 3. Time series of acute CV deaths by cause of death and place of death
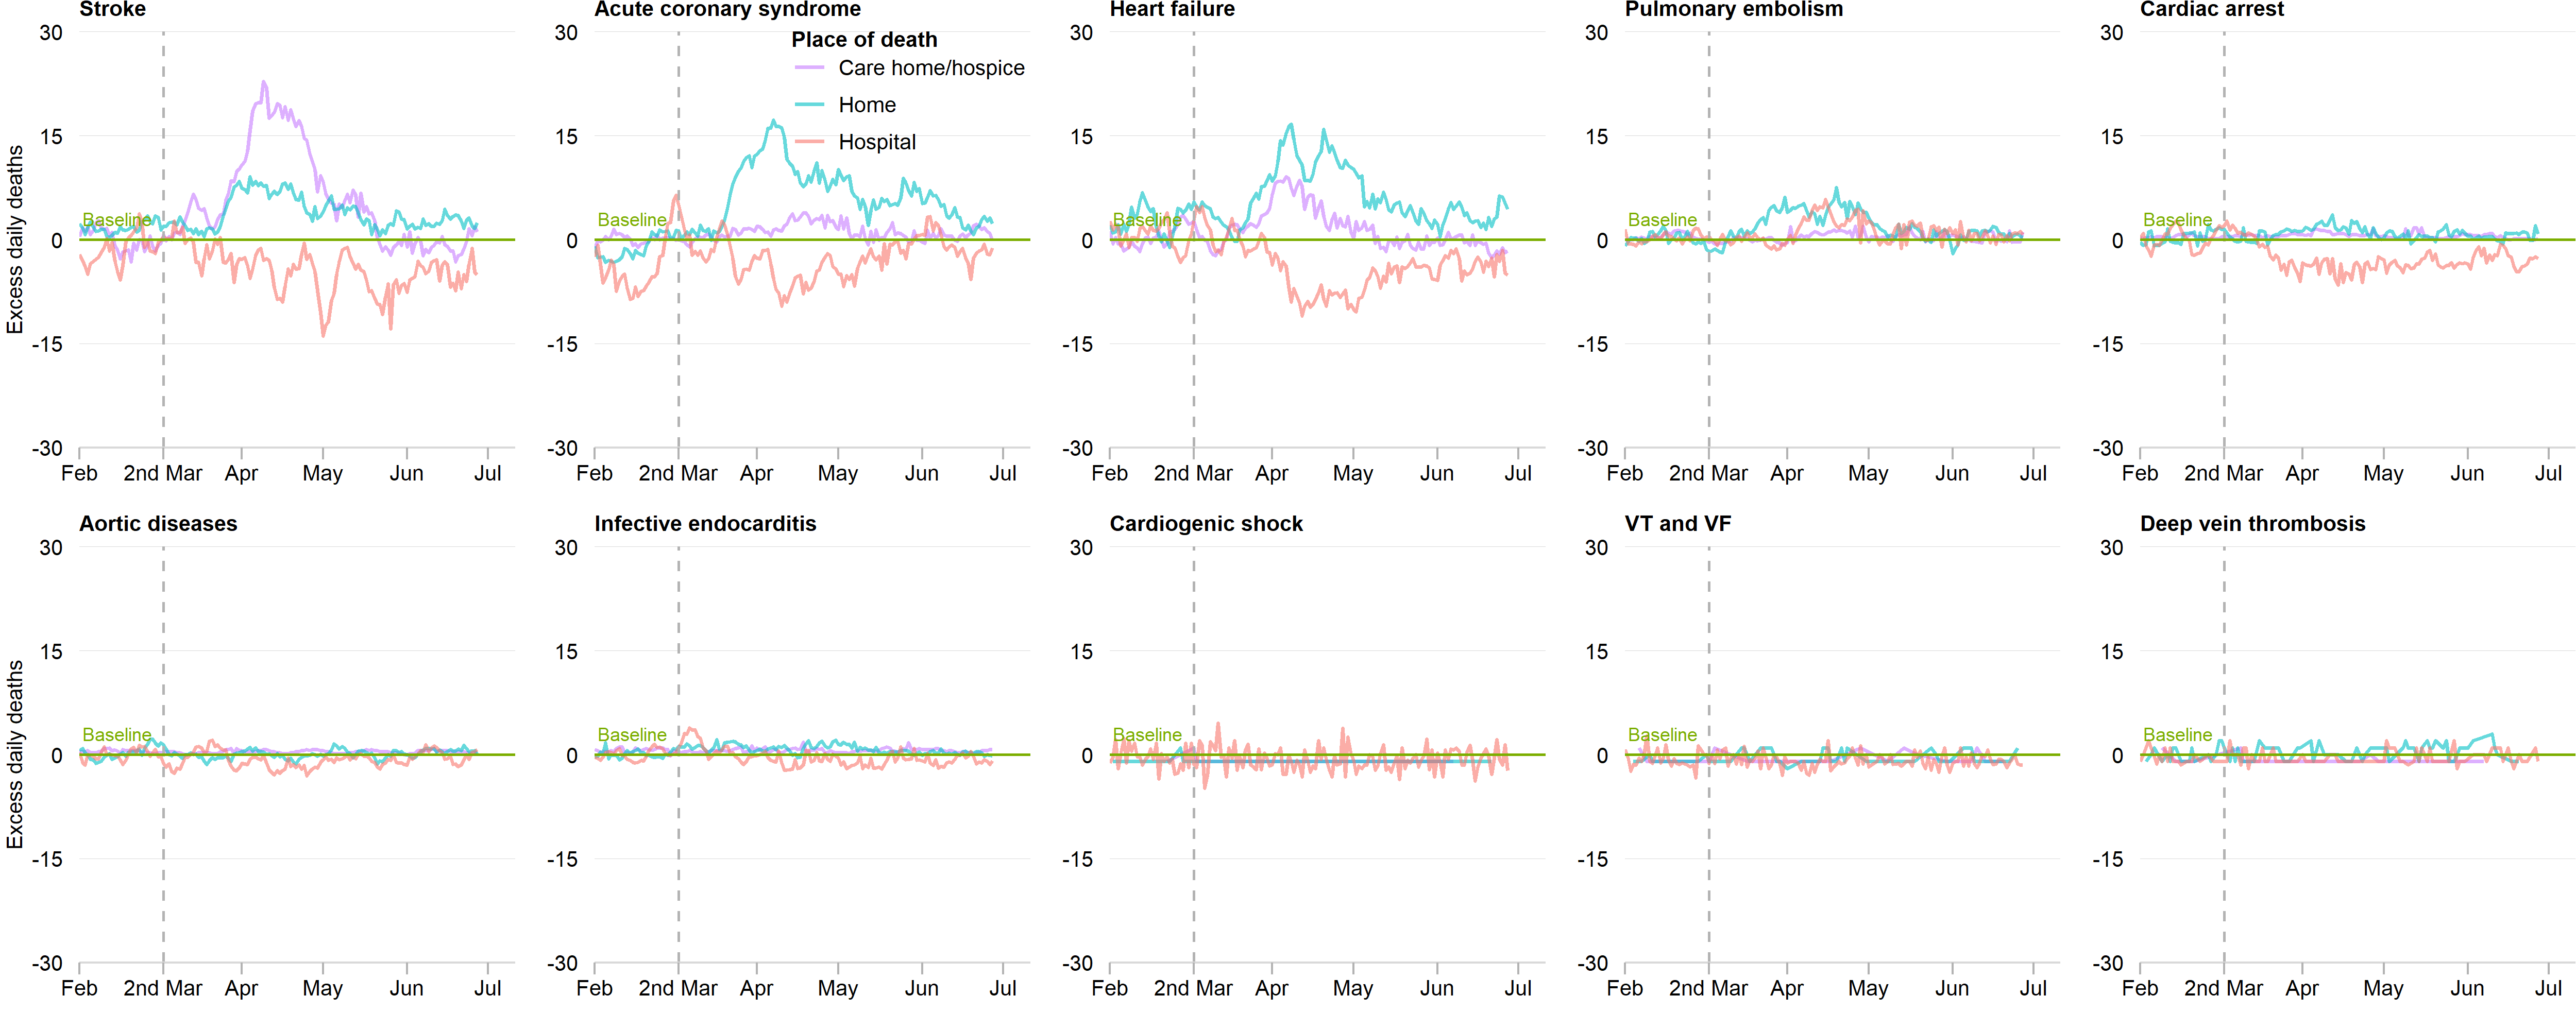
The number of daily CV deaths is presented using a 7-day simple moving average (indicating the mean number of daily CV deaths for that day and the preceding 6 days) from 1st February 2020 up to and including 30th June 2020, adjusted for seasonality. The number of non-COVID-19 excess CV deaths each day from 1st February 2020 were subtracted from the expected daily death estimated using Farrington surveillance algorithm in the same time period. The green line is a zero historical baseline. The red line represents excess daily death at hospital, the purple line represents excess daily CV death at care home and hospice and the blue line represents excess daily CV death at home.
Figure 3. Time series of acute CV deaths by cause of death and place of death (updated 11th November 2020)
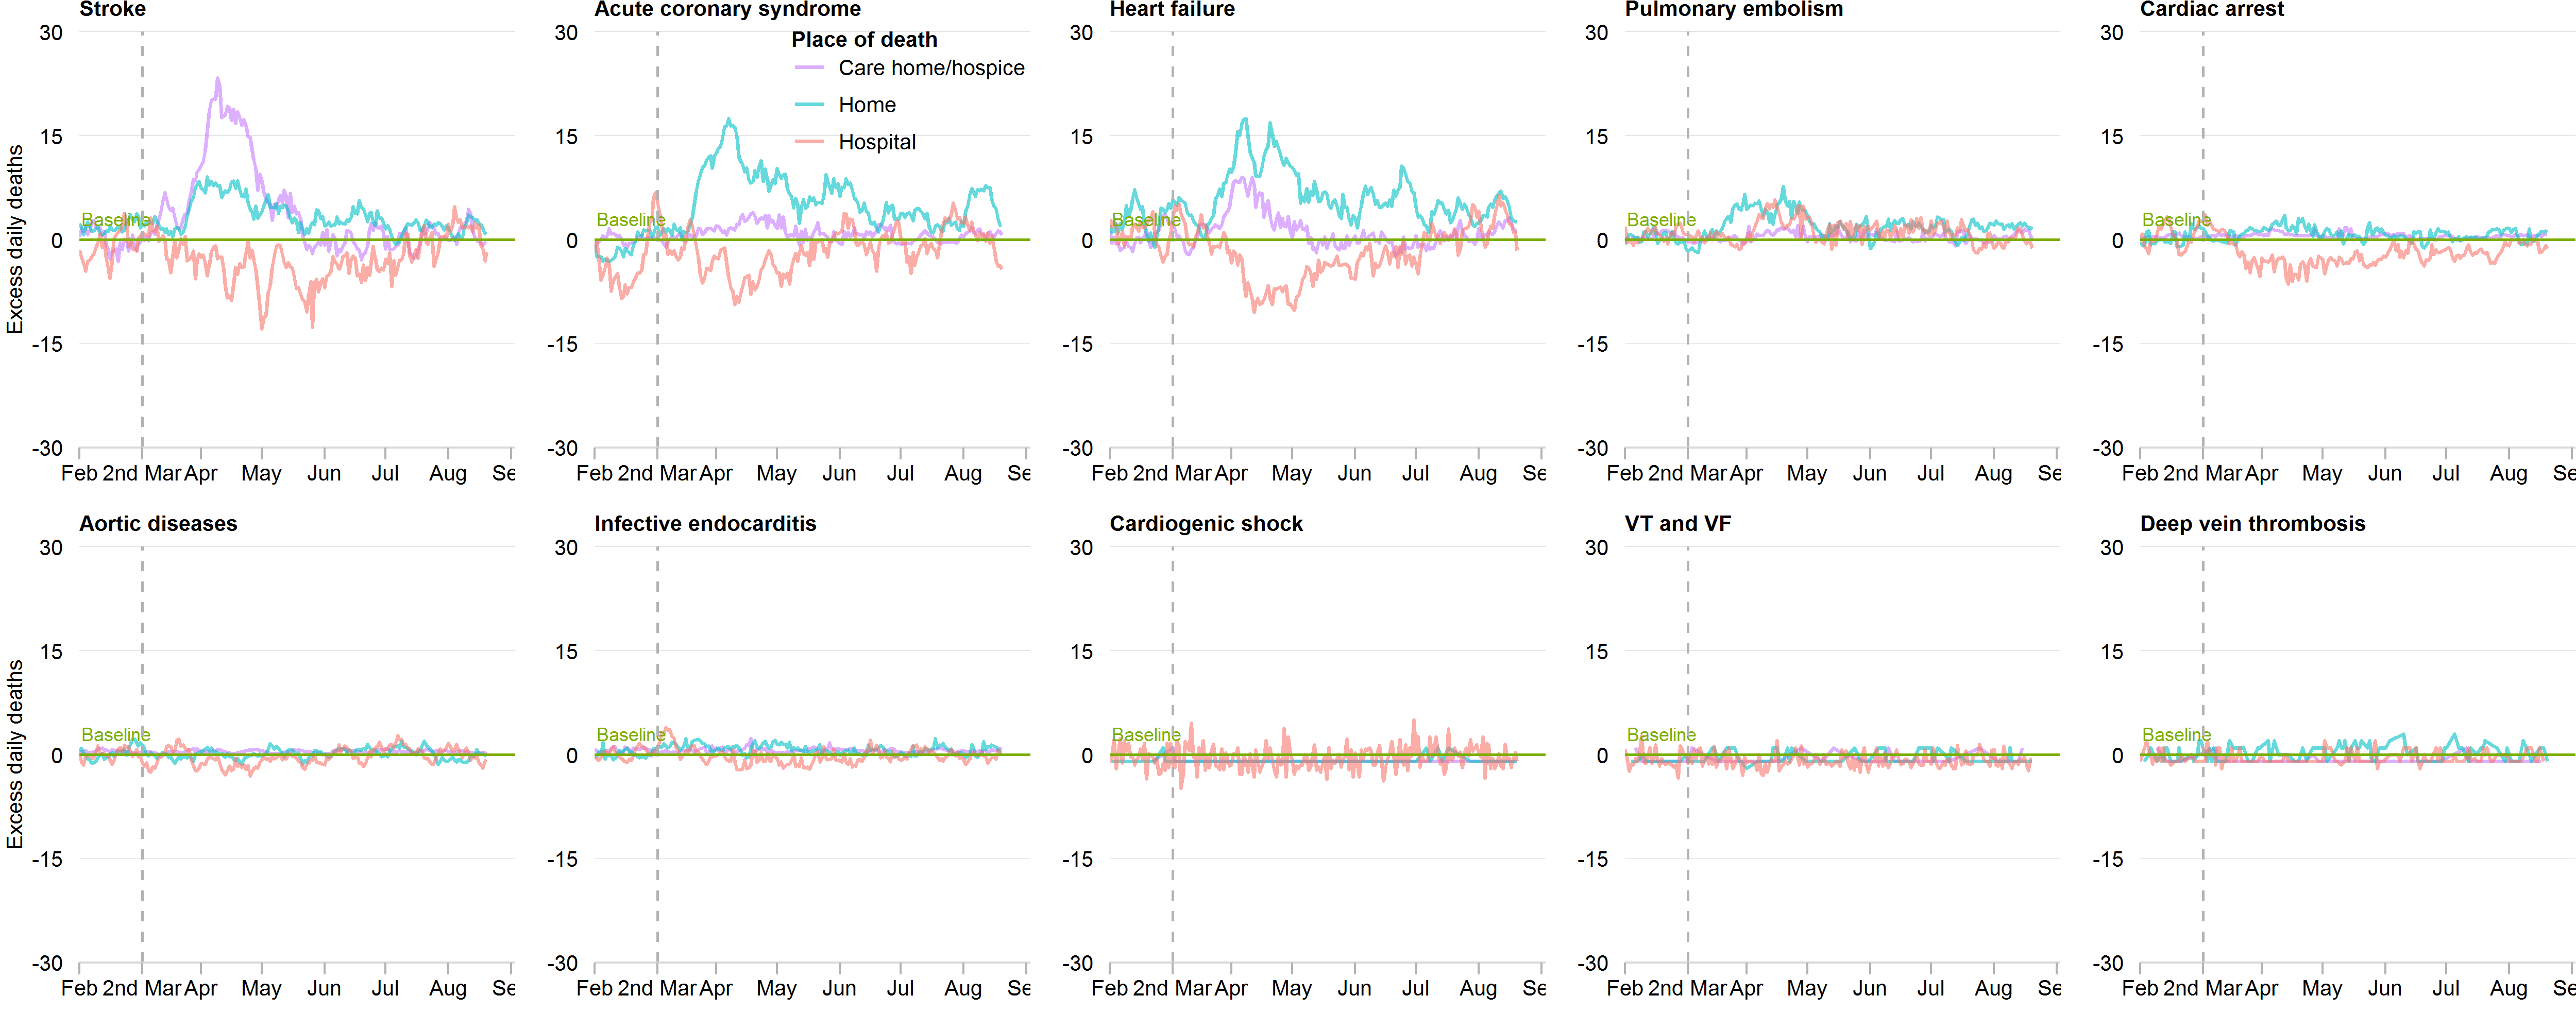
The number of daily CV deaths is presented using a 7-day simple moving average (indicating the mean number of daily CV deaths for that day and the preceding 6 days) from 1st February 2020 up to and including 31th August 2020, adjusted for seasonality. The number of non-COVID-19 excess CV deaths each day from 1st February 2020 were subtracted from the expected daily death estimated using Farrington surveillance algorithm in the same time period. The green line is a zero historical baseline. The red line represents excess daily death at hospital, the purple line represents excess daily CV death at care home and hospice and the blue line represents excess daily CV death at home.